Recent Data Indicate that People with Disabilities are Benefitting from the Arizona Labor Market; More Work to be Done in Education
People with disabilities have long faced significant barriers to fully participate in society. In recent years our laws reflect the importance of the contributions of all people; specifically people with disabilities. The 1990 Americans with Disabilities Act (ADA) marked a significant step forward for U.S. residents. It ensures that people with conditions limiting their physical or mental capabilities are protected from discrimination, including limited access to goods and services available to the general public. Even before this, however, the 1975 Education of Handicapped Children Act guaranteed an appropriate and free public education to all children with disabilities. Reauthorized in 1990, the same year the ADA was passed, the act was renamed to Individuals with Disabilities Education Act (IDEA) and was further expanded by Congress in 1997 and 2004, with additional regulations added since.
Under IDEA, schools must require reasonable accommodations to support the educational advancement of all students. Likewise, Included in IDEA are the categories of disability that are covered by the policy requiring schools to provide accommodation which includes: Autism, deaf-blindness, deafness, developmental delay, emotional disturbance, hearing impairment, intellectual disability, orthopedic impairment, other health impairment, preschool severe delay, specific learning disability, speech or language impairment, traumatic brain injury, visual impairment, and a combination of these. Because of the diversity of these conditions and the varied limitations created in a learning environment, students with disabilities can have a wide variety of outcomes, and many factors contributing to their success can be addressed through tailored accommodations provided by the school.
While IDEA supports students with disabilities to overcome barriers that prevent a quality education, under ADA, employers with 15 or more employees must also provide an equal opportunity to people with disabilities for employment, training, and other benefits.
The Arizona Jobs Progress Meter provides an annual glimpse into how Arizonans with disabilities are doing in two key indicators—Labor Force Participation and Unemployment Rate. By looking at these data, we can learn whether the job market is more accommodating to people with disabilities and how this important group participates in the economy.
Labor Force Participation and Unemployment Rates data disaggregated by race, ethnicity, educational attainment, and disability status are gathered from the annual American Community Survey 1-year estimates (Table S2301) at the state level. The most recent available is 2021, which looks at how people with disabilities are doing in the job market. Overall, just over 60% of Arizonans 16 years old and older are working or actively looking for work, while almost 52% of that age group with a disability are in the labor market. This may seem like a large disparity, but Figure 1 indicates that the 2021 data are substantially more favorable for those with a disability than in prior years before the pandemic. The exact reason for the higher participation has yet to be discovered. Still, it could be related to the opportunity for remote work, gig work, or other emerging options not previously available for those with impairments.
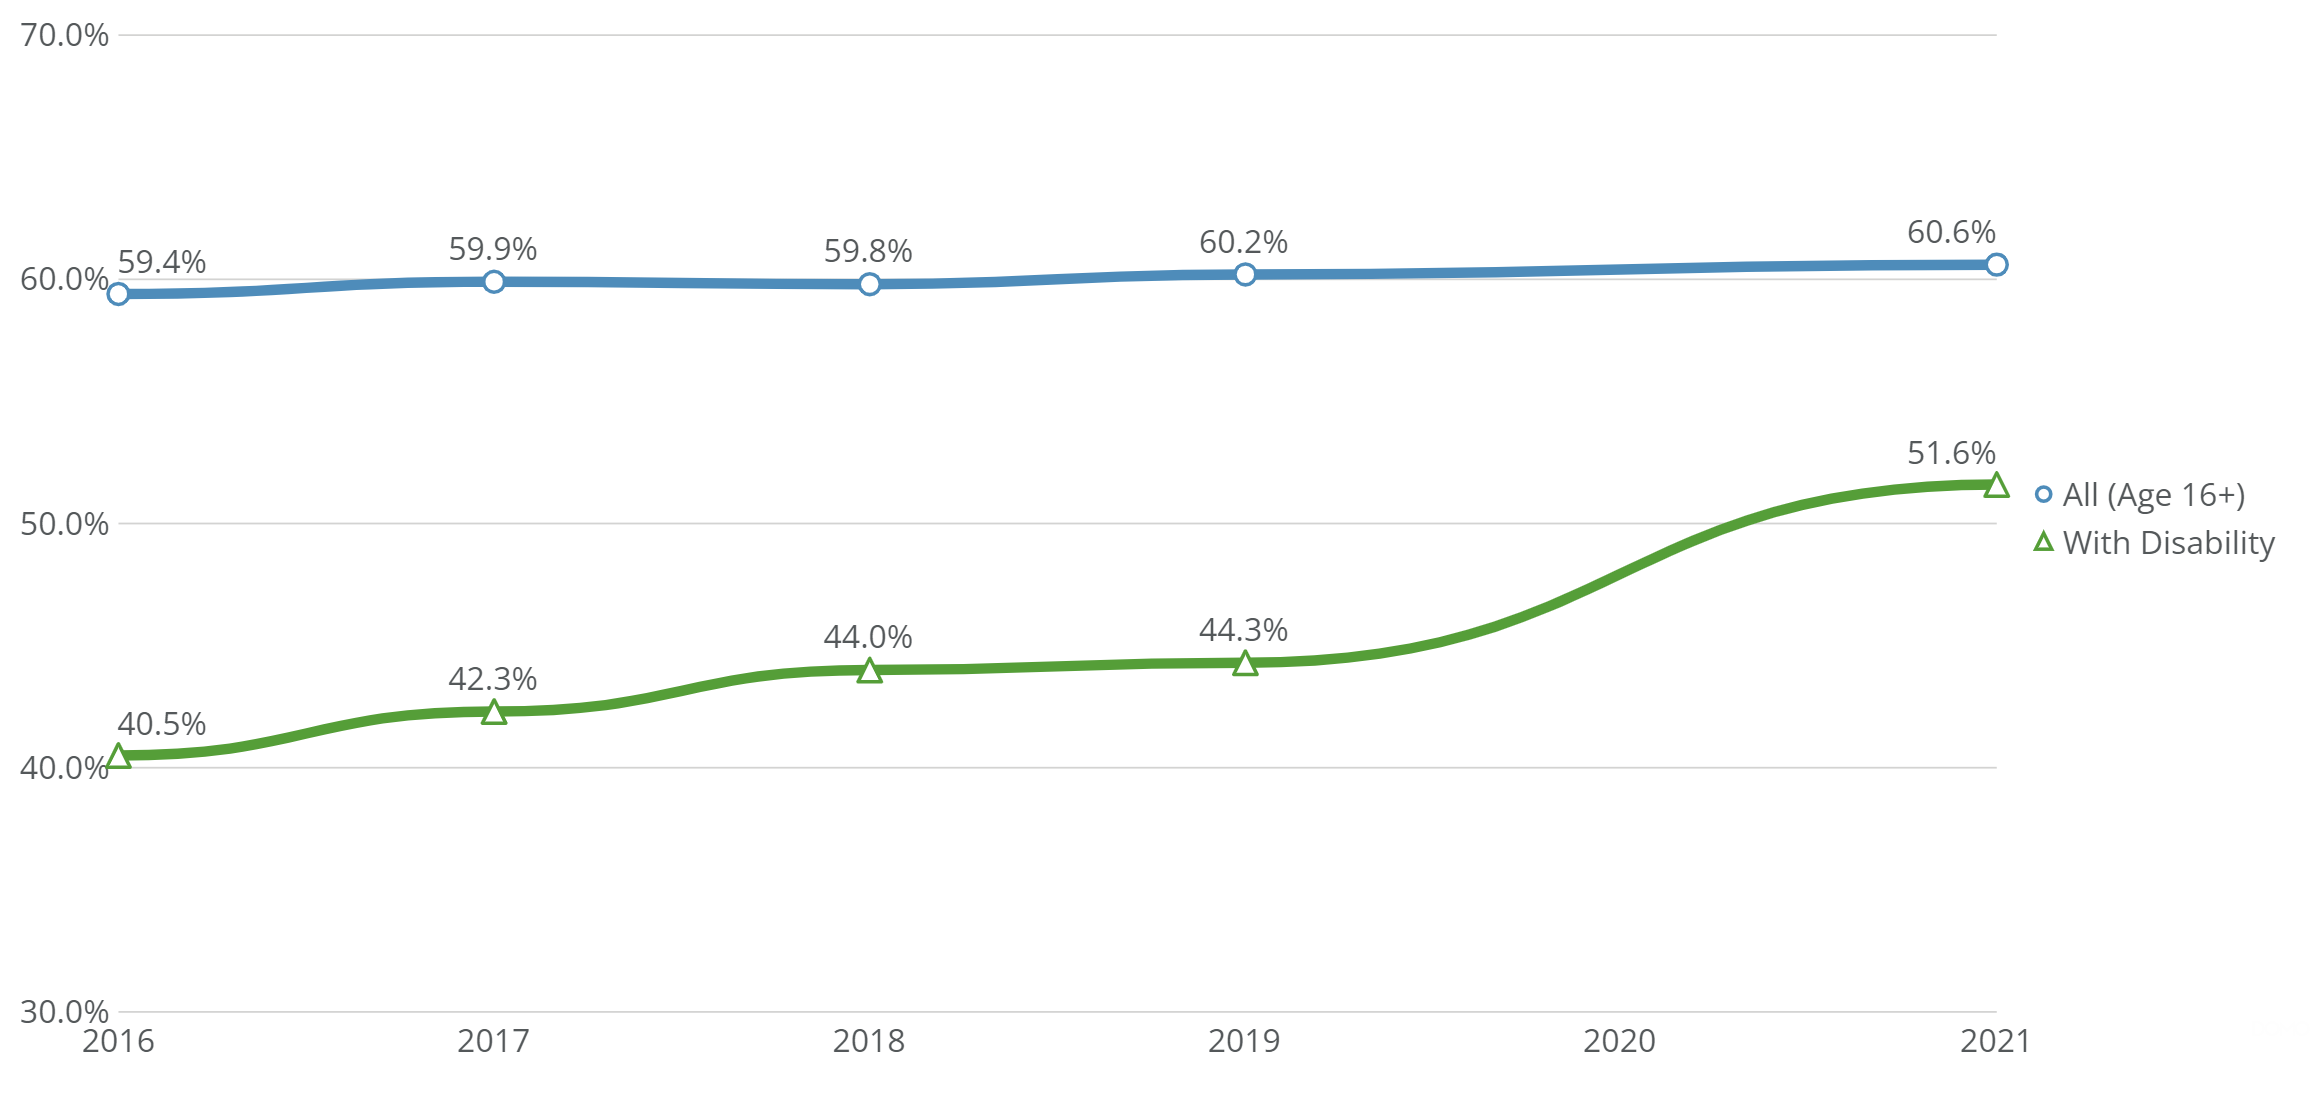
Figure 1: Arizonans with disabilities have a much lower Labor Force Participation Rate than the population, but 2021 numbers indicate an improvement.
While Labor Force Participation is generally positive news for Arizonans with disabilities, the unemployment rate is mixed. Figure 2 indicates that the unemployment rate for people in this group is generally much higher than the population as a whole. Before 2020, the rate had dropped rapidly, from 13% in 2016 to just over 10% in 2019. Data are not available for 2020, but the 2021 rate is back up to 13%--erasing the gains made. While this seems disheartening, when taken with the Labor Force Participation rate, it still indicates that almost 40% of people with disabilities are working, substantially better than the ~27% in 2016. Overall, employment opportunities seem much more abundant than in the past, though there is still work to do.
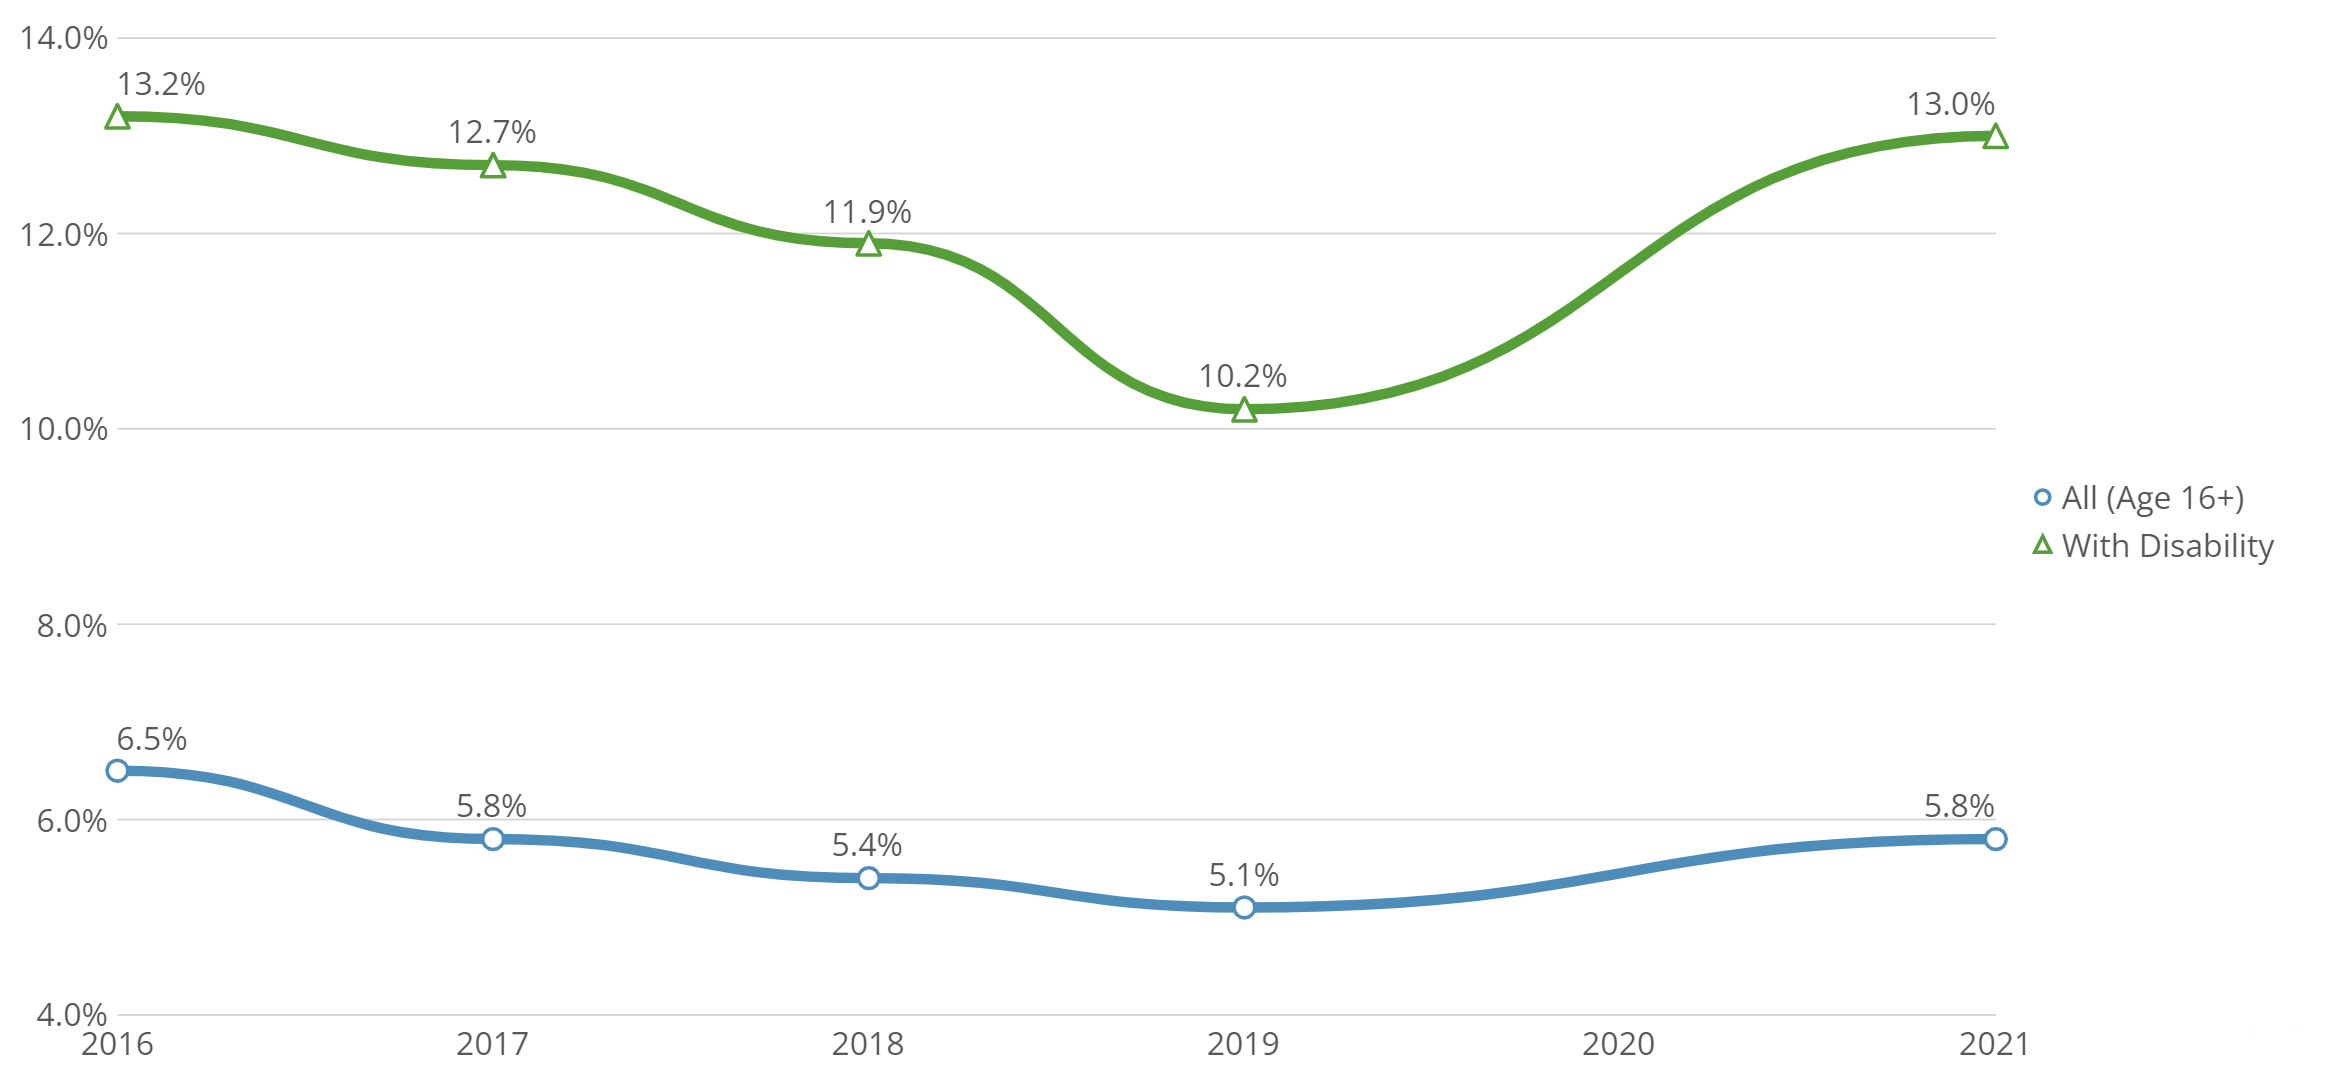
Figure 2: Unemployment is more than two times higher for Arizonans with a disability. However, this, combined with higher labor force participation, indicates that more of this important subgroup are in the workforce than in recent years.
Data from the Arizona Education Progress Meter indicate that there are significant disparities between the outcomes of those who have disabilities and those who do not. Raising awareness of these disparities can help improve conditions and driving solutions. Figure 3 identifies the percentage of students proficient on their state grade level benchmark tests and high school graduation rates. COVID-era impacts seem less severe within this group than with other students, as rates did not drop significantly. Even so, there are notable disparities between students with disabilities and those without.
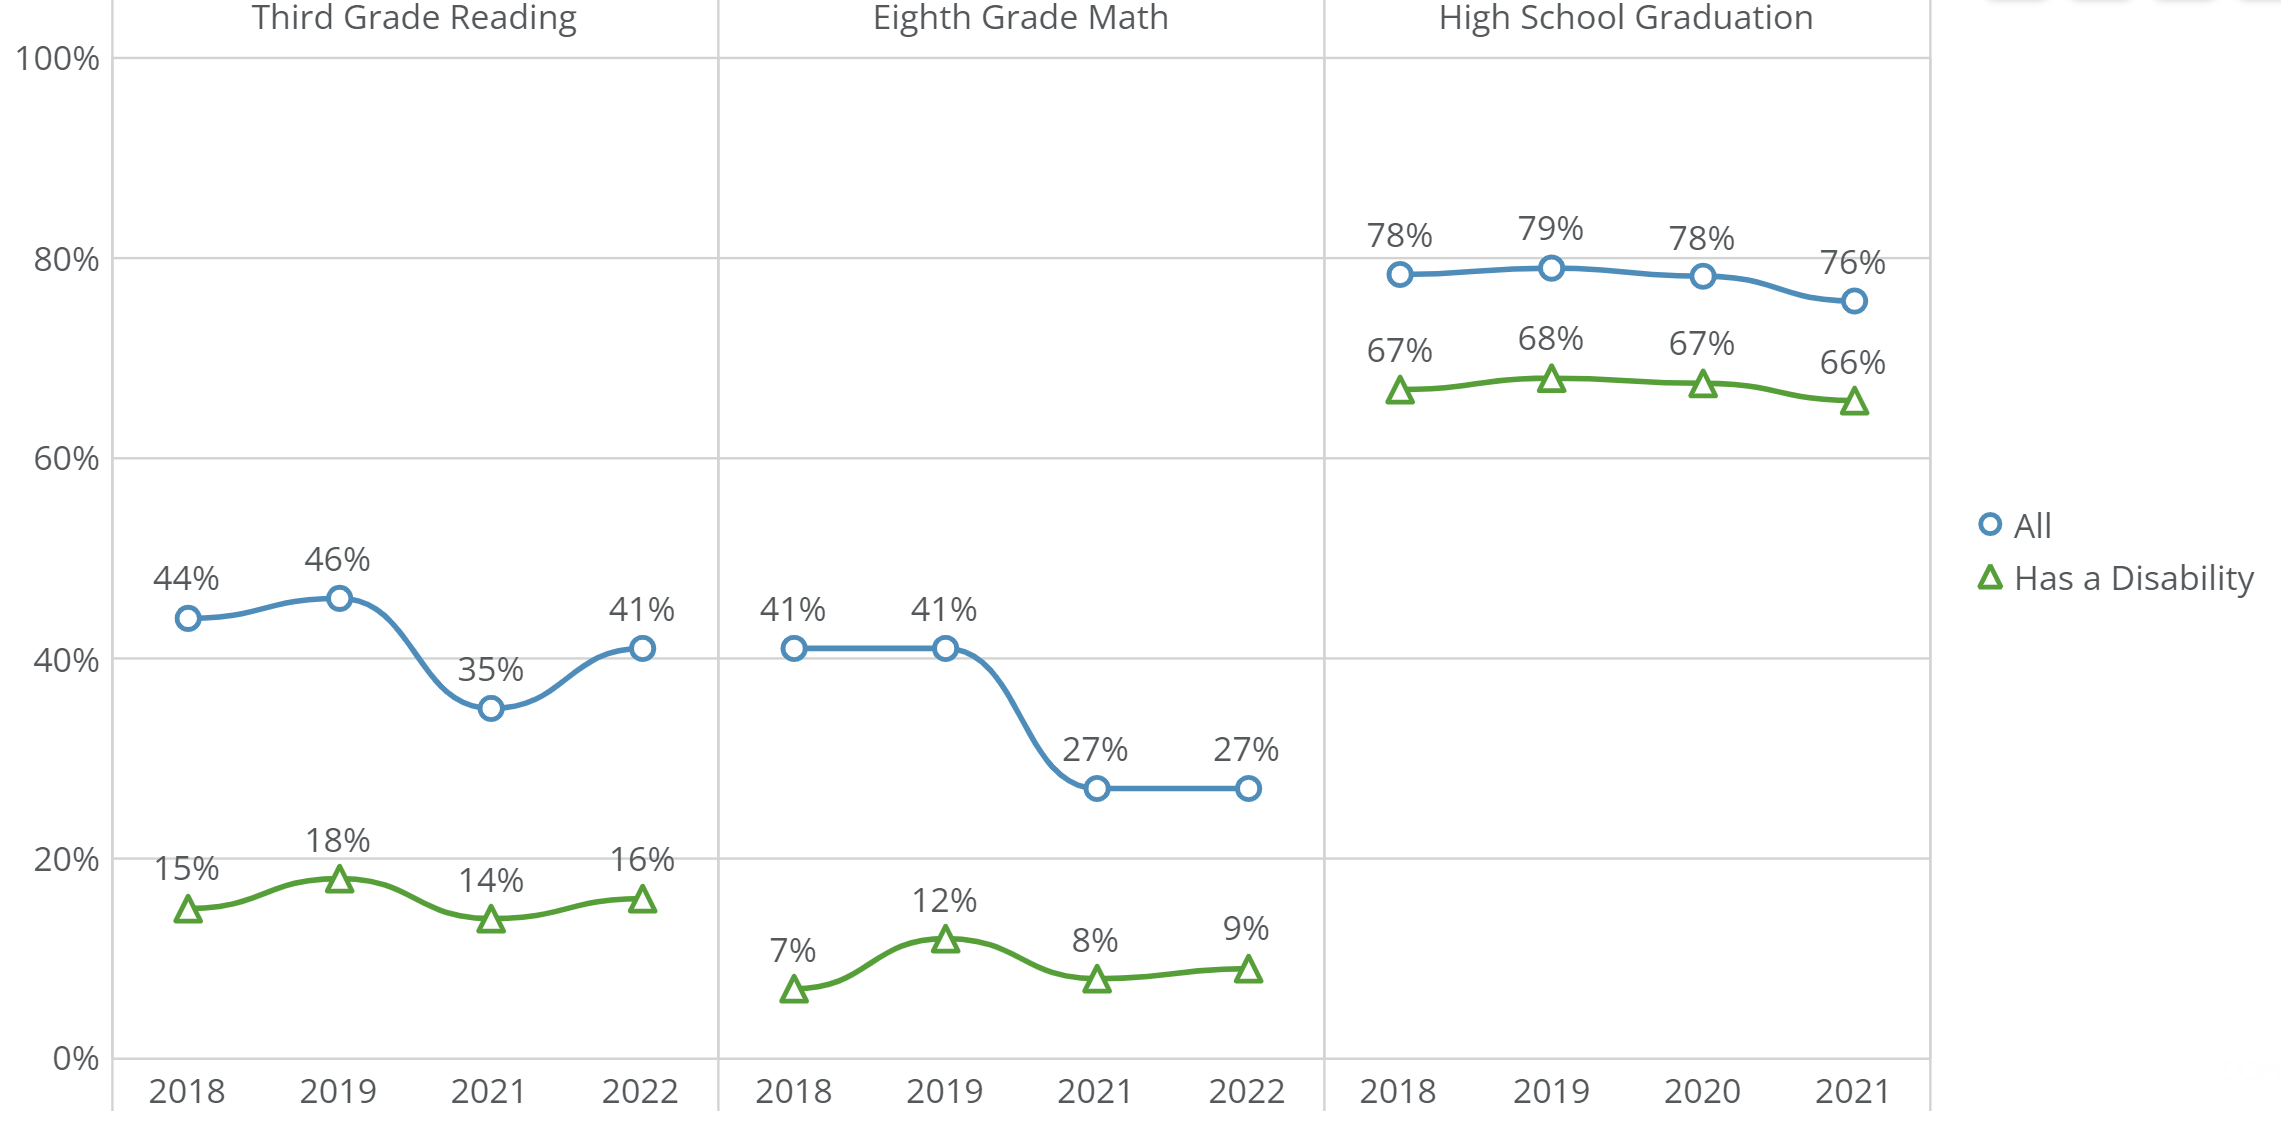
Figure 3: Students with disabilities have lower overall outcomes on Third Grade Reading and Eighth Grade Math proficiency and lower High School Graduation rates than other students.
Other metrics show some positive movement for young Arizonans with disabilities. Echoing the Labor Force Participation data results, Arizonans with a disability who are 16-24 years of age are going to school and entering the workforce at rates higher than in previous years. Known as “Opportunity Youth” or “Disconnected Youth,” about 12% of Arizonans in this age group are not going to school or working, compared with about 23% of those with a disability.
Though still high, about 1 in 3 young Arizonans with a disability were not going to work or school as recently as 2015 compared with 1 in 4 in 2021. Also, more people with a disability have an Associate’s or higher degree than in previous years, reaching 28% in 2021. On a lower note, the COVID-19 pandemic impacted the enrollment rates of students with a disability in post-secondary education. At 19% of the High School graduating class of 2021, this group was affected to a similar degree as other students, as was discussed at length in last month’s article.
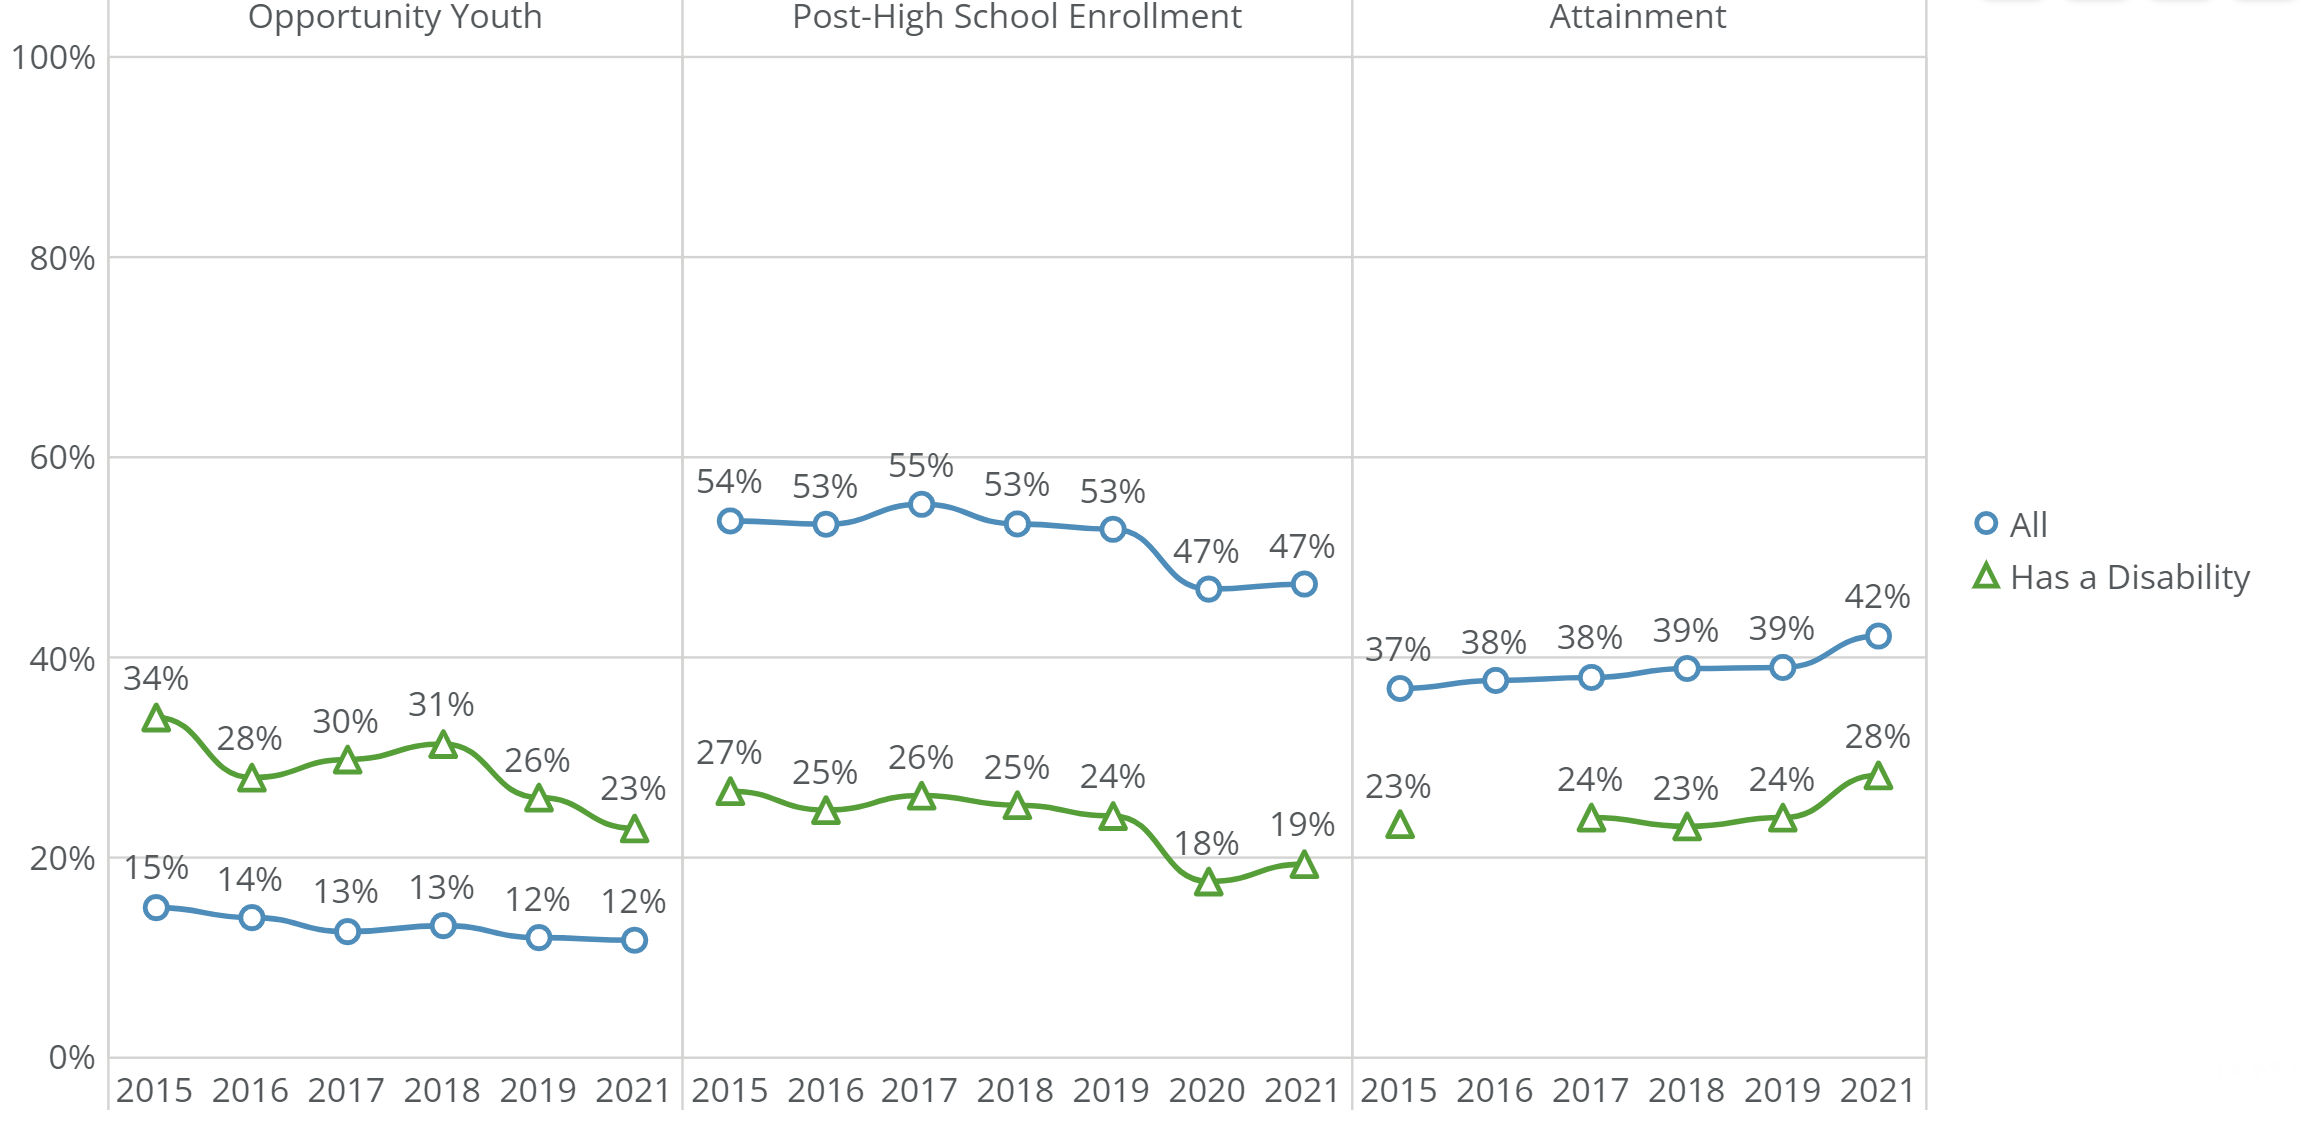
Figure 4: Recent data show improvement in Opportunity Youth and Educational Attainment for Arizonans with a disability, though Post-High School Enrollment remains challenging.
Data from the Arizona Jobs and Education Progress Meters indicate that there is a significant need for ongoing work to ensure that all Arizonans, regardless of disability status, receive an excellent education and have the opportunity to bring their skills, talents, and contributions to the workplace. CFA, with the support of the Arizona Developmental Disabilities Planning Council (ADDPC), is partnering with Arizona Town Hall on a community engagement project designed to bring visibility, spark dialogue, and motivate action to ensure more successful transitions of young people with disabilities into postsecondary education and career pathways.
To learn more about disparities in employment and education for Arizonans with disabilities, visit the Arizona Education and Jobs Progress Meter pages and compare each subgroup. To learn more about CFA’s work with ADDPC and Arizona Town Hall, contact our team.
Why Is It Essential To Identify And Address Disparities In Education And Employment For Those With Disabilities?
Over 89% of Arizonans believe all students deserve an excellent education regardless of family income, race, ethnicity, disability, language spoken, or zip code. Yet only 26% of residents believe our K-12 system is high quality. Disparities exist across demographics, including lower outcomes for students of color, those of lower socio-economic status, and with a disability. Many of these disparities can be addressed through solutions designed to identify the root cause of the shortcoming that can result in better outcomes. CFA has programs in education and the workforce that help to address these challenges, and much more work needs to be done to ensure that all Arizonans have the same opportunity to succeed.
About Our Data Sources
Jobs and education data come from a variety of sources, including:
Education:
- The Arizona Department of Education provides 3rd Grade Reading, 8th Grade Math, and High School Graduation data.
- College-going data are provided by the Arizona Board of Regents, the Arizona Department of Education, and the National Center for Education Statistics.
- Attainment and Opportunity, The U.S. Census Bureau Public provides youth data. Use Microdata Sample 1-year American Community Survey estimates.
Jobs:
- State data referenced in this piece are provided by the U.S. Census Bureau American Community Survey 1-year estimates, Table S2301
About Arizona Progress Meters
CFA developed the Arizona Progress Meters as a tool for policymakers, business leaders, civic leaders, educators, and others across the state to understand how Arizona is doing in areas critical to achieving The Arizona We Want. Eight Arizona Progress Meters provide valuable and regularly updated data on 80+ metrics in education, jobs, healthcare, environment, civic engagement, infrastructure, and more to support policymakers and other leaders’ data-driven dialogue, decision-making, and action.Learn more and leverage all the Arizona Progress Meters today >>