Understanding the Latest Data on Air Quality: An Important Factor in Overall Health and Well-Being in Arizona
Did you know the air we breathe in Arizona is something we're keeping a close eye on? It's all part of Arizona's Progress Meters - a way to keep track of how we (the state of Arizona) are doing in areas that matter to us Arizonans. In this update, we're diving into air quality, and it's more interesting than you might think!
What's in Our Air?
The Arizona Health and Well-Being Progress Meter includes measures of air quality sourced from the Arizona Department of Environmental Quality. We mainly look at three common pollutants in our air:
- Ozone: This isn't just a layer way up in the sky; it's also closer to home. It can make it tough to breathe, especially for folks with asthma.
- Particulate Matter 10 (PM 10): Think of this as tiny dust particles. This dust can irritate our lungs and eyes, especially in more populated areas like Phoenix and Tucson.
- Particulate Matter 2.5 (PM 2.5): These are even tinier particles that can get deep into our lungs. They're linked to some severe health issues.
Why Air Quality Matters
The deserts of Arizona used to be a haven for allergy sufferers. That’s not true anymore. Phoenix has been ranked pretty high for air pollution in recent years. It's like being on a top 5 list you don't want to be on.
Poor air quality isn't just uncomfortable – it can lead to health problems and affect our daily lives, especially in communities near freeways and airports. Additionally, these problems often hit minority and low-income neighborhoods harder than others.
Air quality isn't just about health – it affects businesses, too. If we don't meet certain standards, companies might have to think twice before setting up shop, expanding, or staying here.
Moreover, and most importantly, CFA’s research shows that 80% of Arizonans want better air quality in the next decade – for our health, environment, and economy.
What's Being Done?
There's good news! Efforts are being made to reduce these pollutants – from special gasoline blends to promoting public transit. And while we've made progress, there's still work to do.
As Arizonans, we all play a part. Whether it's staying informed, supporting clean air initiatives, or just understanding what the air quality means for your health, every bit helps.
Keep reading for an in-depth explainer and review of the data, including visual graphs, a key feature available for all Arizona Progress Meter data.
Dig Deeper – Full Data Analysis
Arizona Progress Meter Update on Air Quality: Phoenix Ozone Levels Remain High; Air Quality a Challenge for Phoenix and Pinal Counties
Ozone is composed of three oxygen atoms and naturally occurs predominantly in the upper atmosphere, where it helps protect the Earth from harmful ultraviolet rays. Ground-level ozone is harmful to public health and the environment because it irritates the respiratory system and affects vegetation and ecosystems. Ground-level ozone occurs predominantly because of reactions between oxides of nitrogen and volatile organic compounds, which accelerate in hot and sunny environments. This is why Arizona and other sunny desert areas with many motorized vehicles are more likely to have higher ozone levels than other locations. Among other actions, different blends of gasoline, vehicle smog inspections, efforts to increase public transit, and moving from gasoline to alternative-fueled vehicles have all been implemented to various degrees to help combat ozone pollution in Arizona.
Particulate Matter 10 is composed of particles of less than 10 microns. PM 10 is predominantly dust and is much more likely to occur in hot and dry climates with less vegetation, like the Sonoran Desert in which Phoenix and Tucson are situated. PM 10 also harms public health and quality of life as it can trigger respiratory problems and irritation of the eyes, throat, and lungs. Among other actions, requiring dust control permits and dust suppression for construction projects, paving roads, and agricultural dust prevention measures help to address PM 10 pollution.
Particulate Matter 2.5 is a more harmful pollutant than PM 10, as the particles can go deeper into the lungs and even the bloodstream, causing cancer, preterm births, and other illnesses. The National Institutes of Health estimate that about 4 million people die annually worldwide from PM 2.5. Among other actions, regional pollution control measures include instituting no-burn days, not permitting new wood-burning fireplaces in residences, regulating the days on which fireworks are permitted to be set off, and other actions to help reduce harmful occurrences of high PM 2.5 concentrations.
In recent years, the American Lung Association has rated Phoenix to be among the worst cities for air pollution nationally, and its 2023 report card places the city 5th worst for high ozone days, 13th worst for daily particle pollution, and 7th worst for annual particle pollution. [1] Bad air quality tends to concentrate in low-lying areas, especially around freeways and airports, which tend to be occupied by minority communities and economically disadvantaged families. Poor air is also found in areas with less vegetation, especially in lower-income neighborhoods with fewer trees, gardens, and grassy lawns. This can help reduce and mitigate ground-level pollution.
Each pollutant has established standards by the Environmental Protection Agency (EPA) on which communities are graded. A standard measure of the concentration of pollutants is the number of days that exceed the federal limit within a calendar year. Figure 1 describes the number of days that the average concentration of the pollutants over an 8-hour period was over the standard in 2022 (2023 annual data will not be available for a few more months). It is evident that Ozone and PM 10 exceedances are more likely to occur in Phoenix and Pinal County than in other parts of the state. Note the 53 days when Phoenix exceeded the Ozone standard, which occurred mainly in the summer months when an abundance of sun and heat accelerated the production of ground-level Ozone.
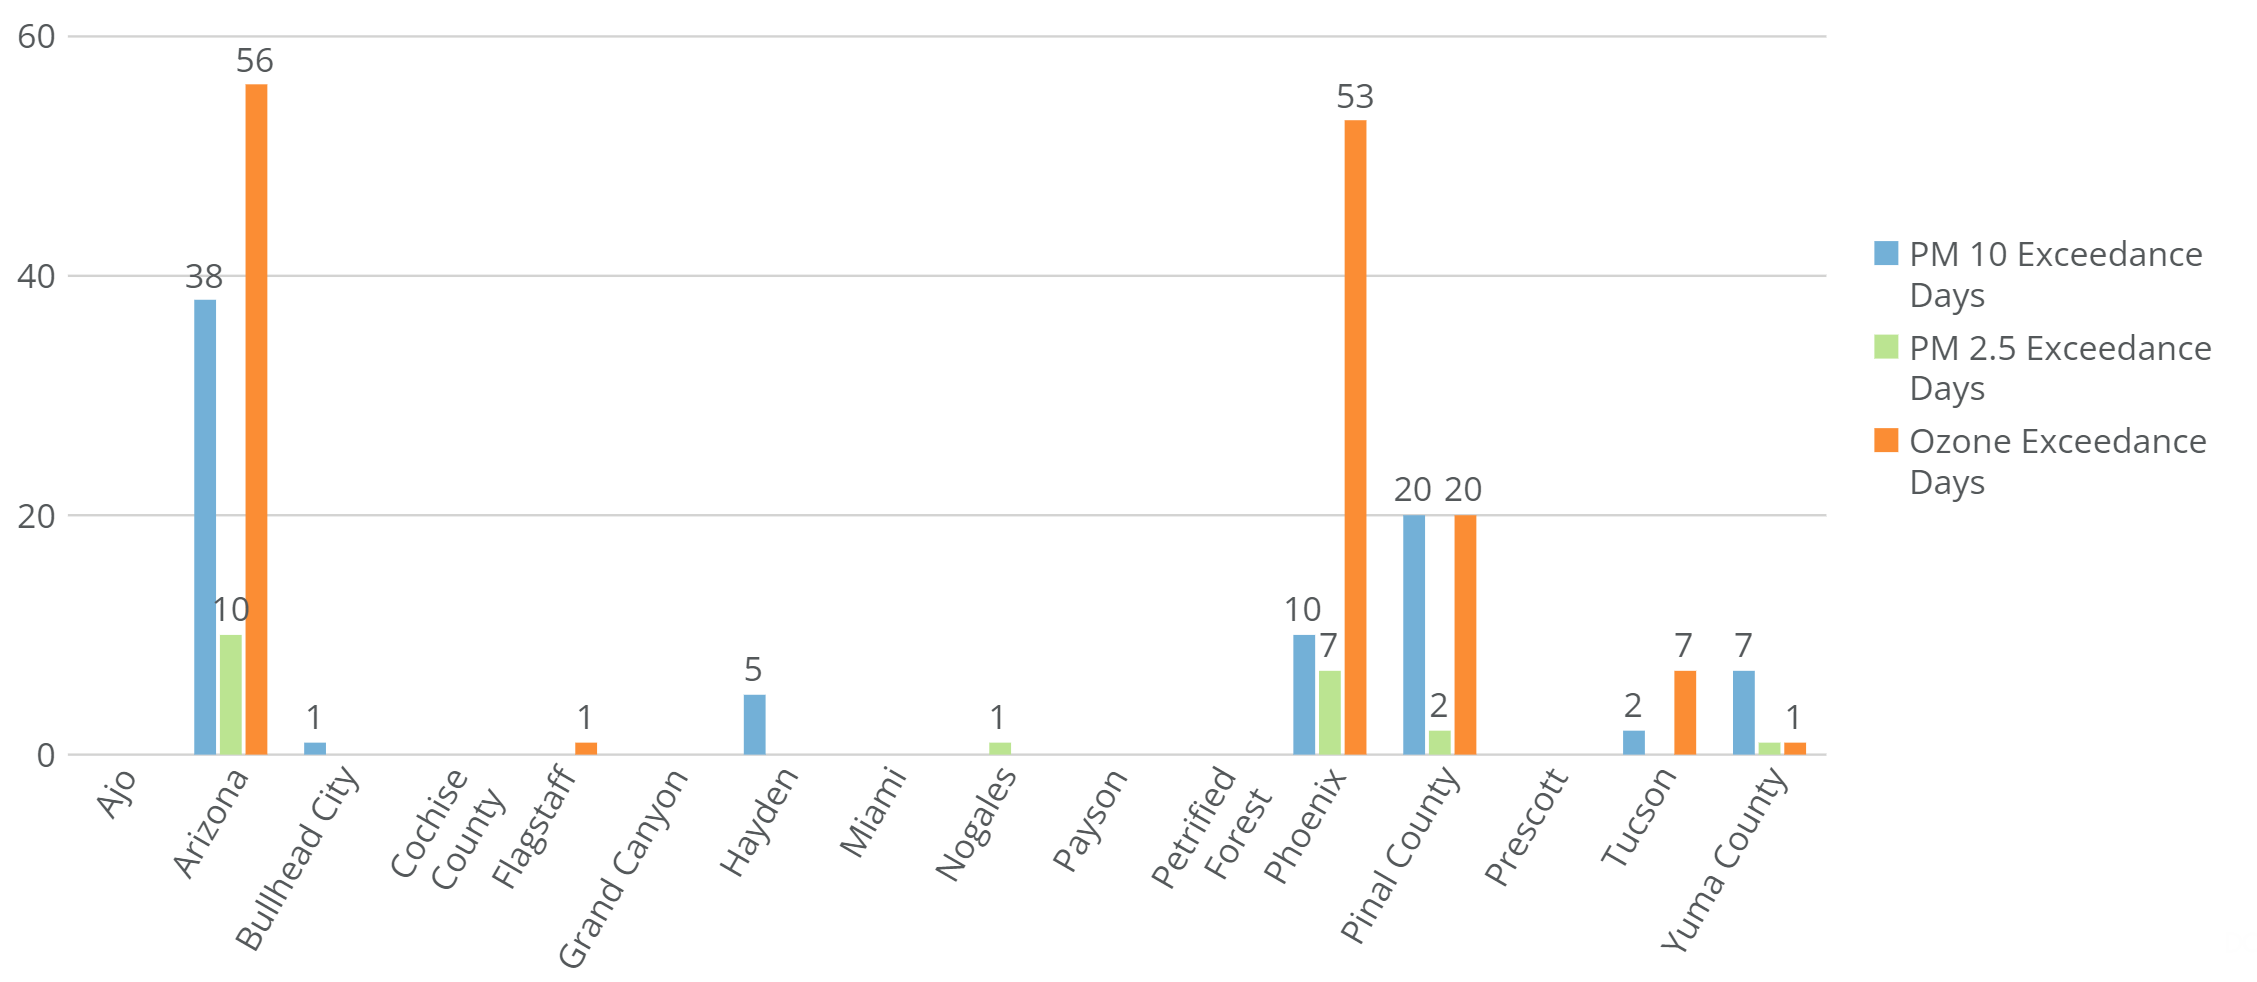
Figure 1: Number of days where 8-hour average concentrations of the pollutant exceeded federal standards.
Figures 2-4 show the number of days in each calendar year where Phoenix, Pinal County, and Tucson exceeded the federal 8-hour average allowed concentration for each Ozone, PM 10 and PM 2.5. Note that Phoenix's best year for Ozone was 2016, when there were still over 30 days of high concentration (Arizona Progress Meter data go back to 2015 for this metric). PM 10 is also challenging for Arizona’s most populous urban area, especially in recent years, as construction activities have accelerated. Though 53 days seem high, Phoenix had 90+ days exceeding the federal limit each year in the early 2000s, indicating that some progress has been made.
Pinal County sees high concentration days for Ozone, but it is more challenged than its neighbors with PM 2.5, where it had 18 exceedance days in 2020, though 2021 and 2022 were much better. Tucson has generally fewer exceedance days, averaging only 5 for Ozone since 2018 and less than one per year for the other two pollutants.
In addition to public health and environmental concerns, pollution that exceeds federal standards can significantly impact economic development. Federal regulators have recently been escalating mitigation measures in the Phoenix metropolitan area in response to its continued challenge in meeting standards. Recently, the region moved from a “marginal” to a “moderate” non-attainment classification and may receive a “serious” category in the coming year, which will require companies to pay environmental offsets if they choose to move to the region. [2]
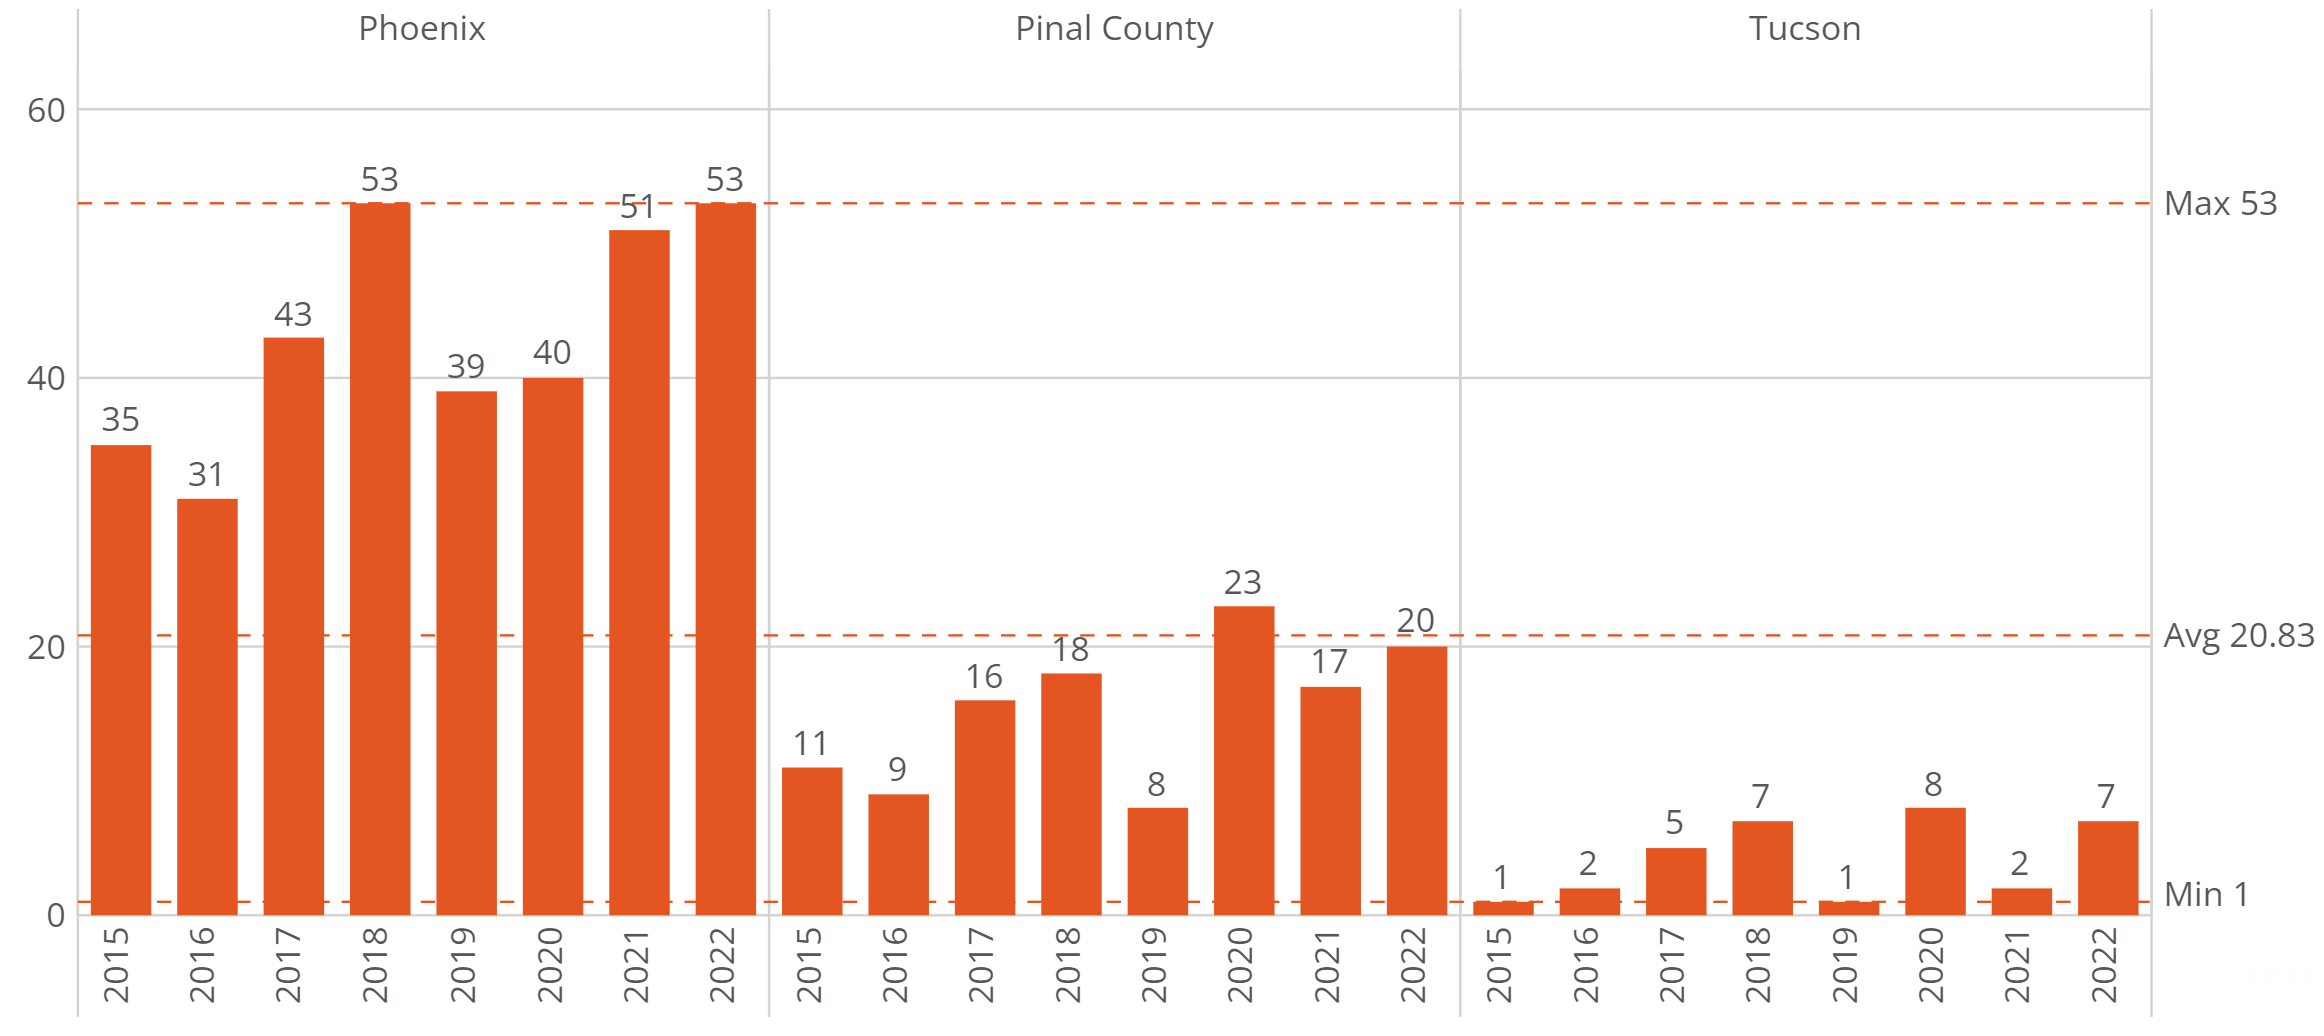
Figure 2: Ozone number of days that exceeded the federal standard for 8-hour average concentration.
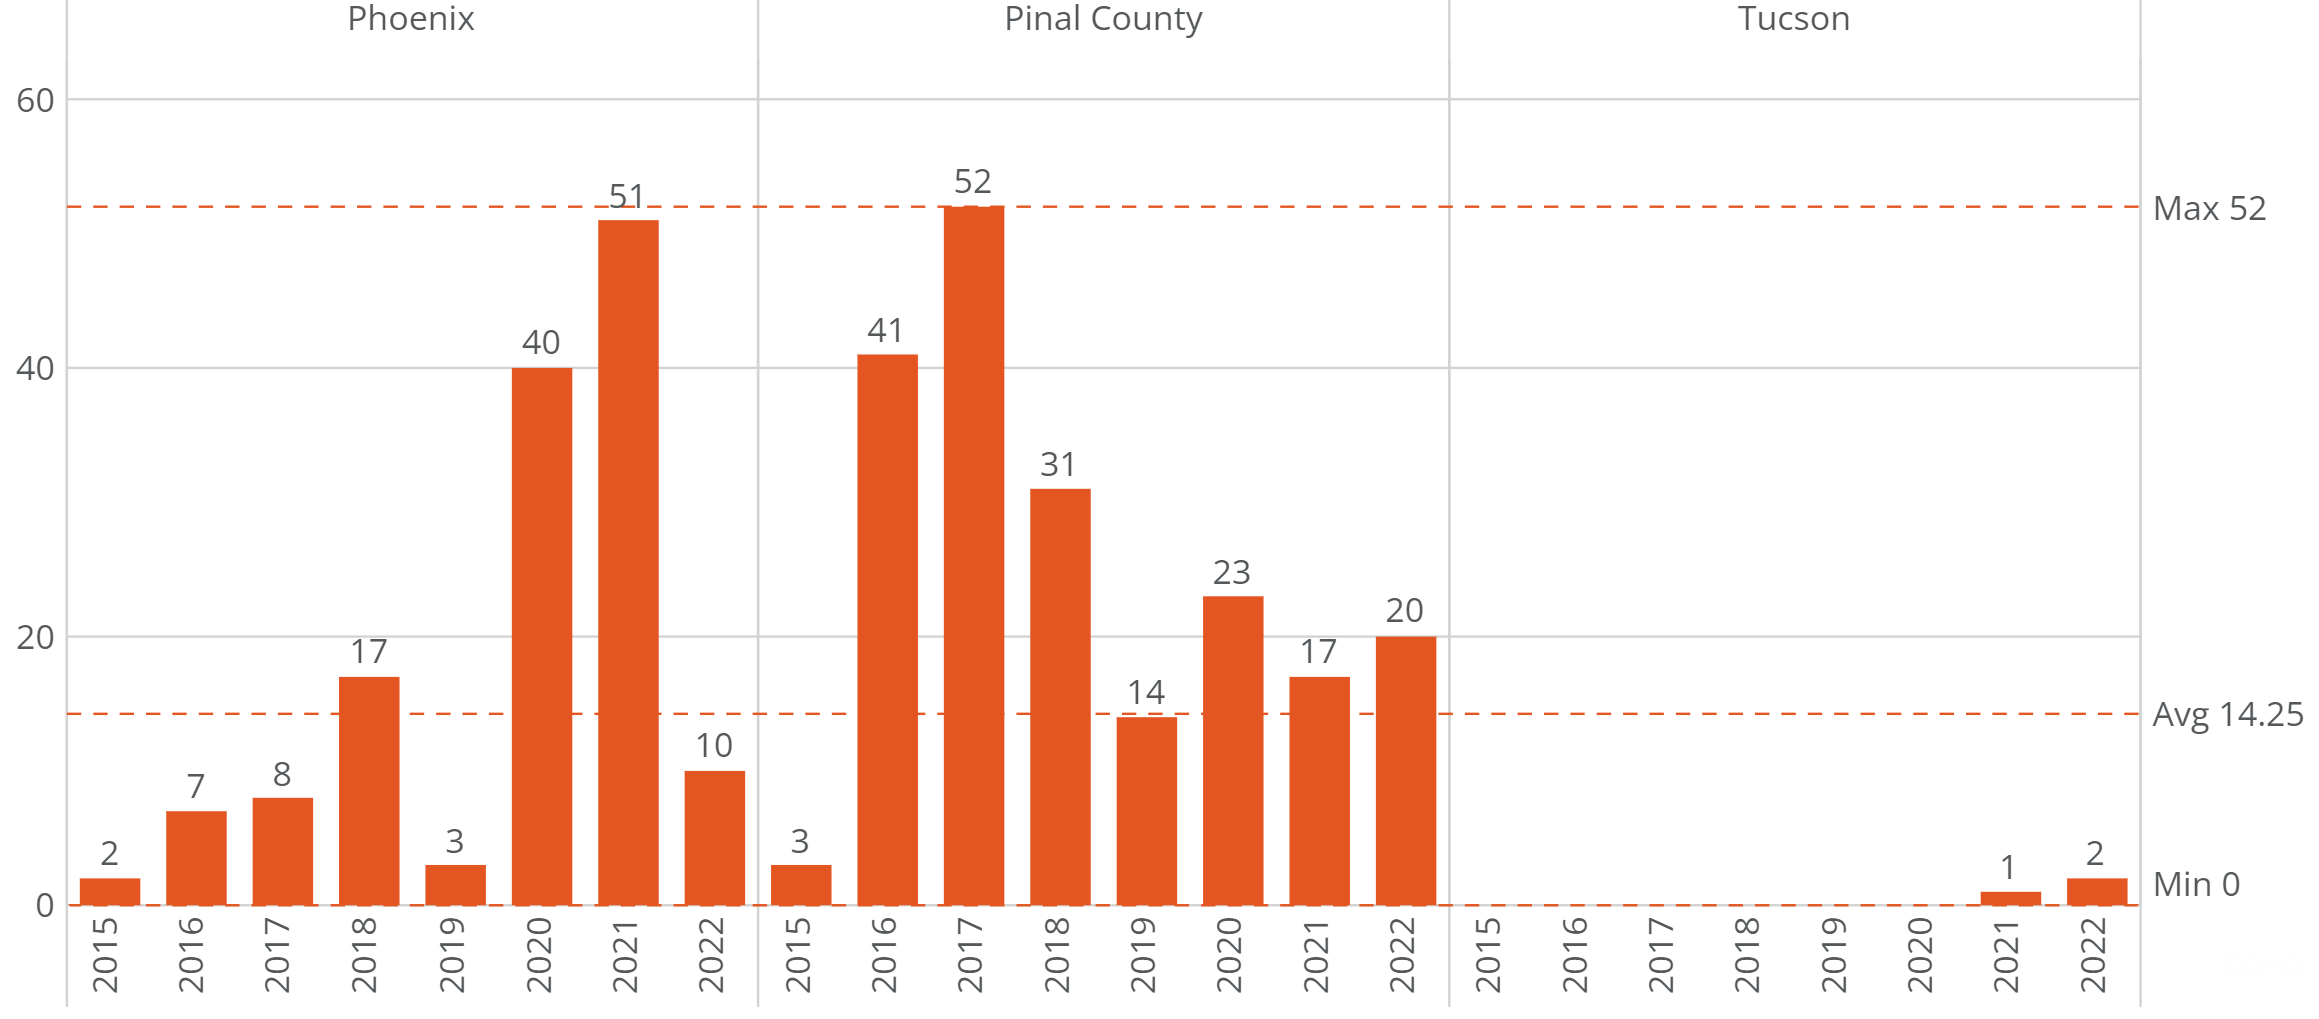
Figure 3: PM 10 days exceeding the federal standard for 8-hour average concentration.
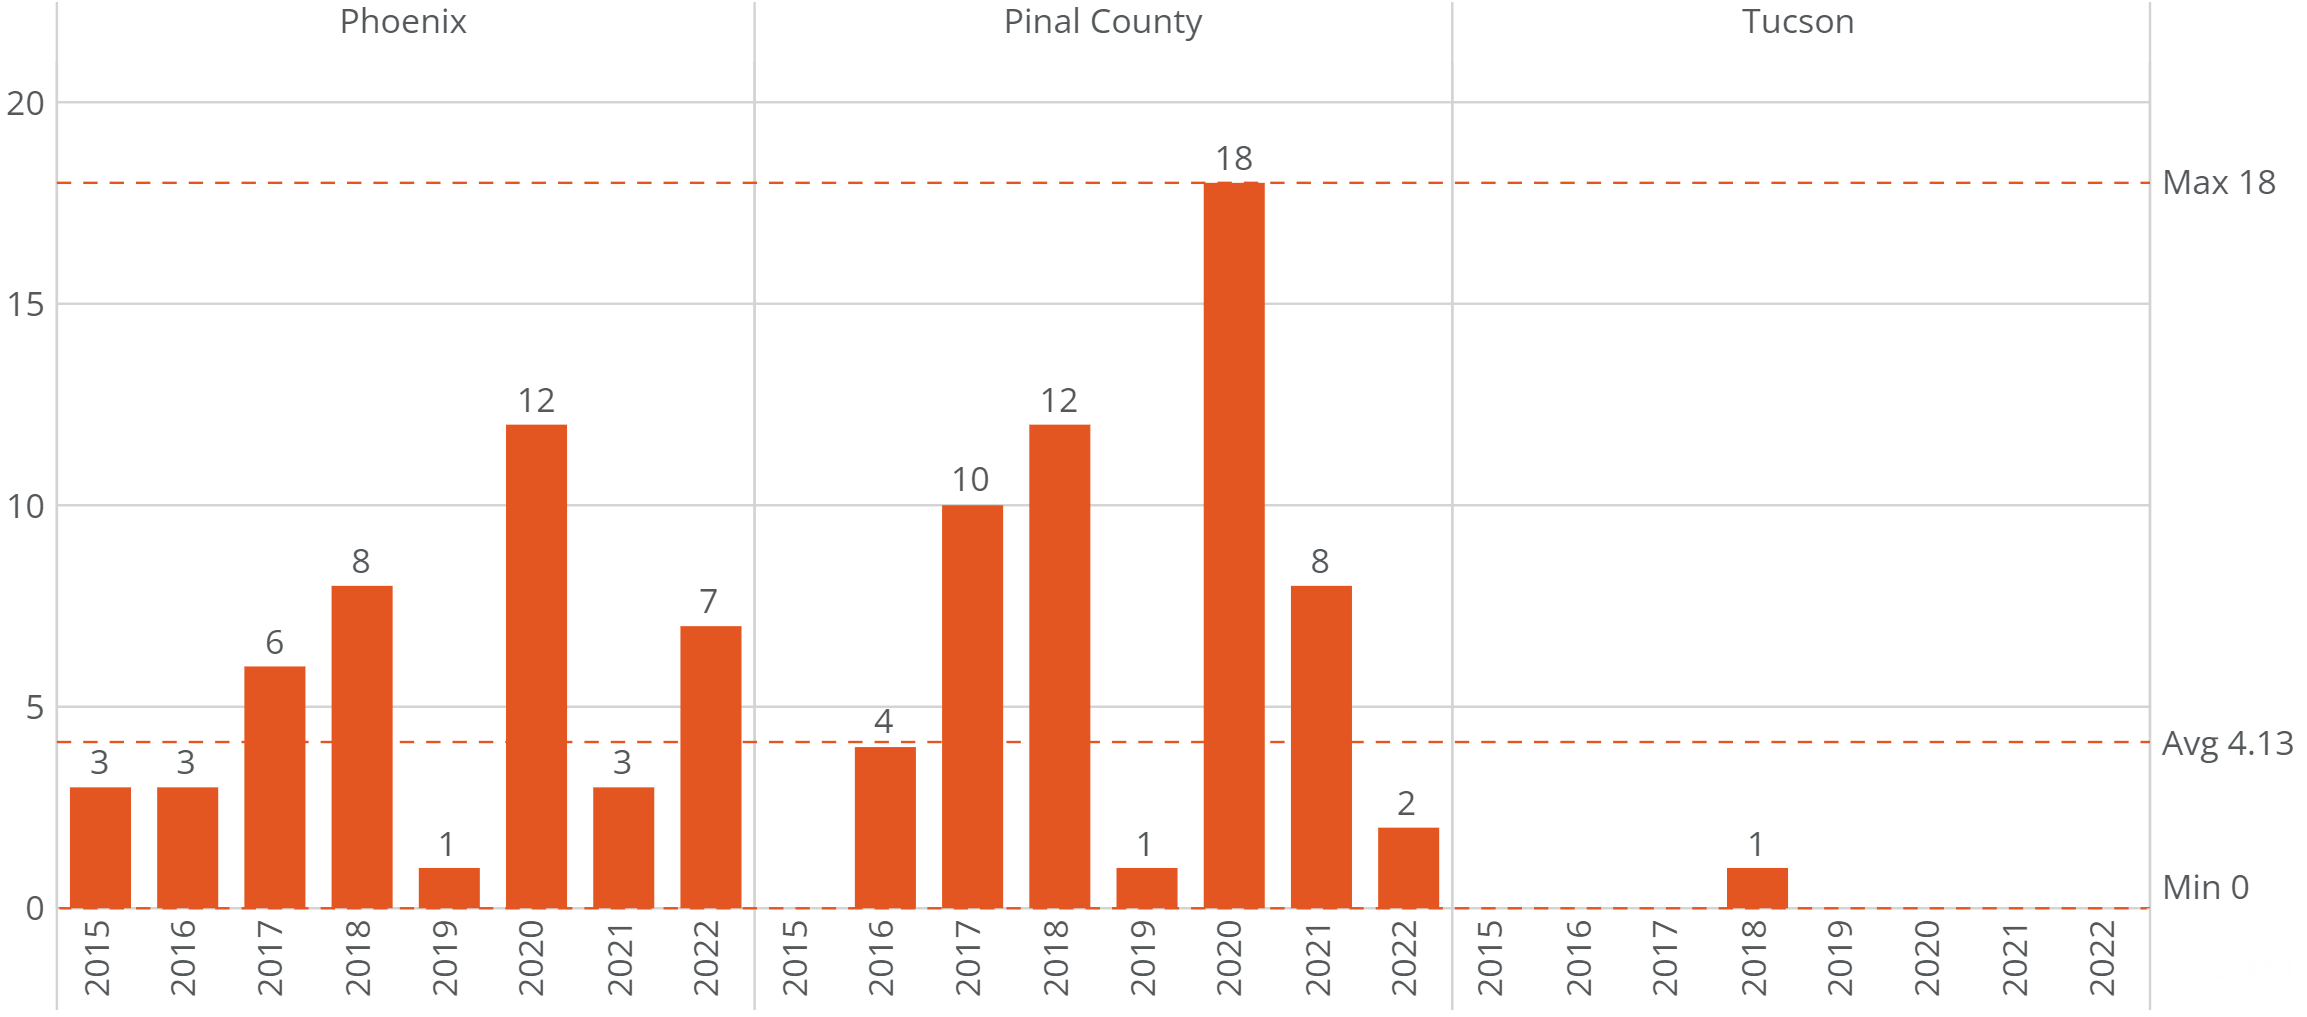
Figure 4: PM 2.5, the number of days that exceeded the federal standard for 8-hour average concentration.
Continued attention to air quality is vital to the health and economic well-being of Arizona. Though much of the state enjoys clean air, some parts, particularly the Phoenix area, are challenged with addressing dust, smoke, and ground-level ozone concentrations. Sensitive populations can monitor concentrations of pollutants and stay indoors when they are at an unhealthy level. Still, it is also essential that leaders and communities continue to explore ways to improve air quality for the benefit of all Arizonans.
About Our Data Sources
The Arizona Health and Well-Being Progress Meter was developed with the input of experts and stakeholders and was launched in April 2019. Access all the measures and data.
As with all the Arizona Progress Meters, data are publicly available from trusted and regularly updated sources. Data used in the Arizona Health and Well-Being Progress Meter on Air Quality are sourced from the Arizona Department of Environmental Quality. Data are updated annually from the published annual air quality report.
1 https://www.lung.org/research/sota/city-rankings/msas/phoenix-mesa-az