Arizona Education Progress Meter Update Center for the Future of Arizona (CFA) and Education Forward Arizona recently released updates to the Arizona Education Progress Meter, the state’s widely accepted framework for measuring P-20 education.
The most recent update of the Arizona Education Progress Meter gives a renewed look at the condition of Arizona’s public education system. Composed of eight indicators or metrics, Arizona’s education leaders developed the Arizona Education Progress Meter to provide an annual look at how the state is doing in education from pre-kindergarten to post-secondary attainment. The Arizona Education Progress Meter also provides goals that stand as targets to achieve by 2030 (except Teacher Pay, which will be assessed in the spring of 2024). These goals and our recent trends toward achieving them are depicted in Figures 1 and 2.
Arizona Education Progress Meter Updates
| Metric/Indicator | Current Data Timeframe | Prev. | Current Data | % Change (previous > new) | Statewide 2030 Goal |
|---|---|---|---|---|---|
|
Quality Early Learning |
2022 Year |
21% |
27% |
+6% |
45% |
|
Third-Grade Reading |
2023 Cohort |
41% |
41% |
- |
72% |
|
Eighth-Grade Math |
2023 Cohort |
27% |
27% |
- |
69% |
|
High School Graduation Rate |
2022 Cohort |
76% |
77% |
+1% |
90% |
|
Post-High School Enrollment |
2022 Cohort |
48% |
48% |
- |
70% |
|
Opportunity Youth |
2023 Year |
12% |
12% |
- |
7% |
|
Post-Secondary Attainment |
2023 Year |
48% |
48% |
- |
60% |
Figure 1: The indicators in the Arizona Education Progress Meter included in this update, along with the timeframe of the new data.
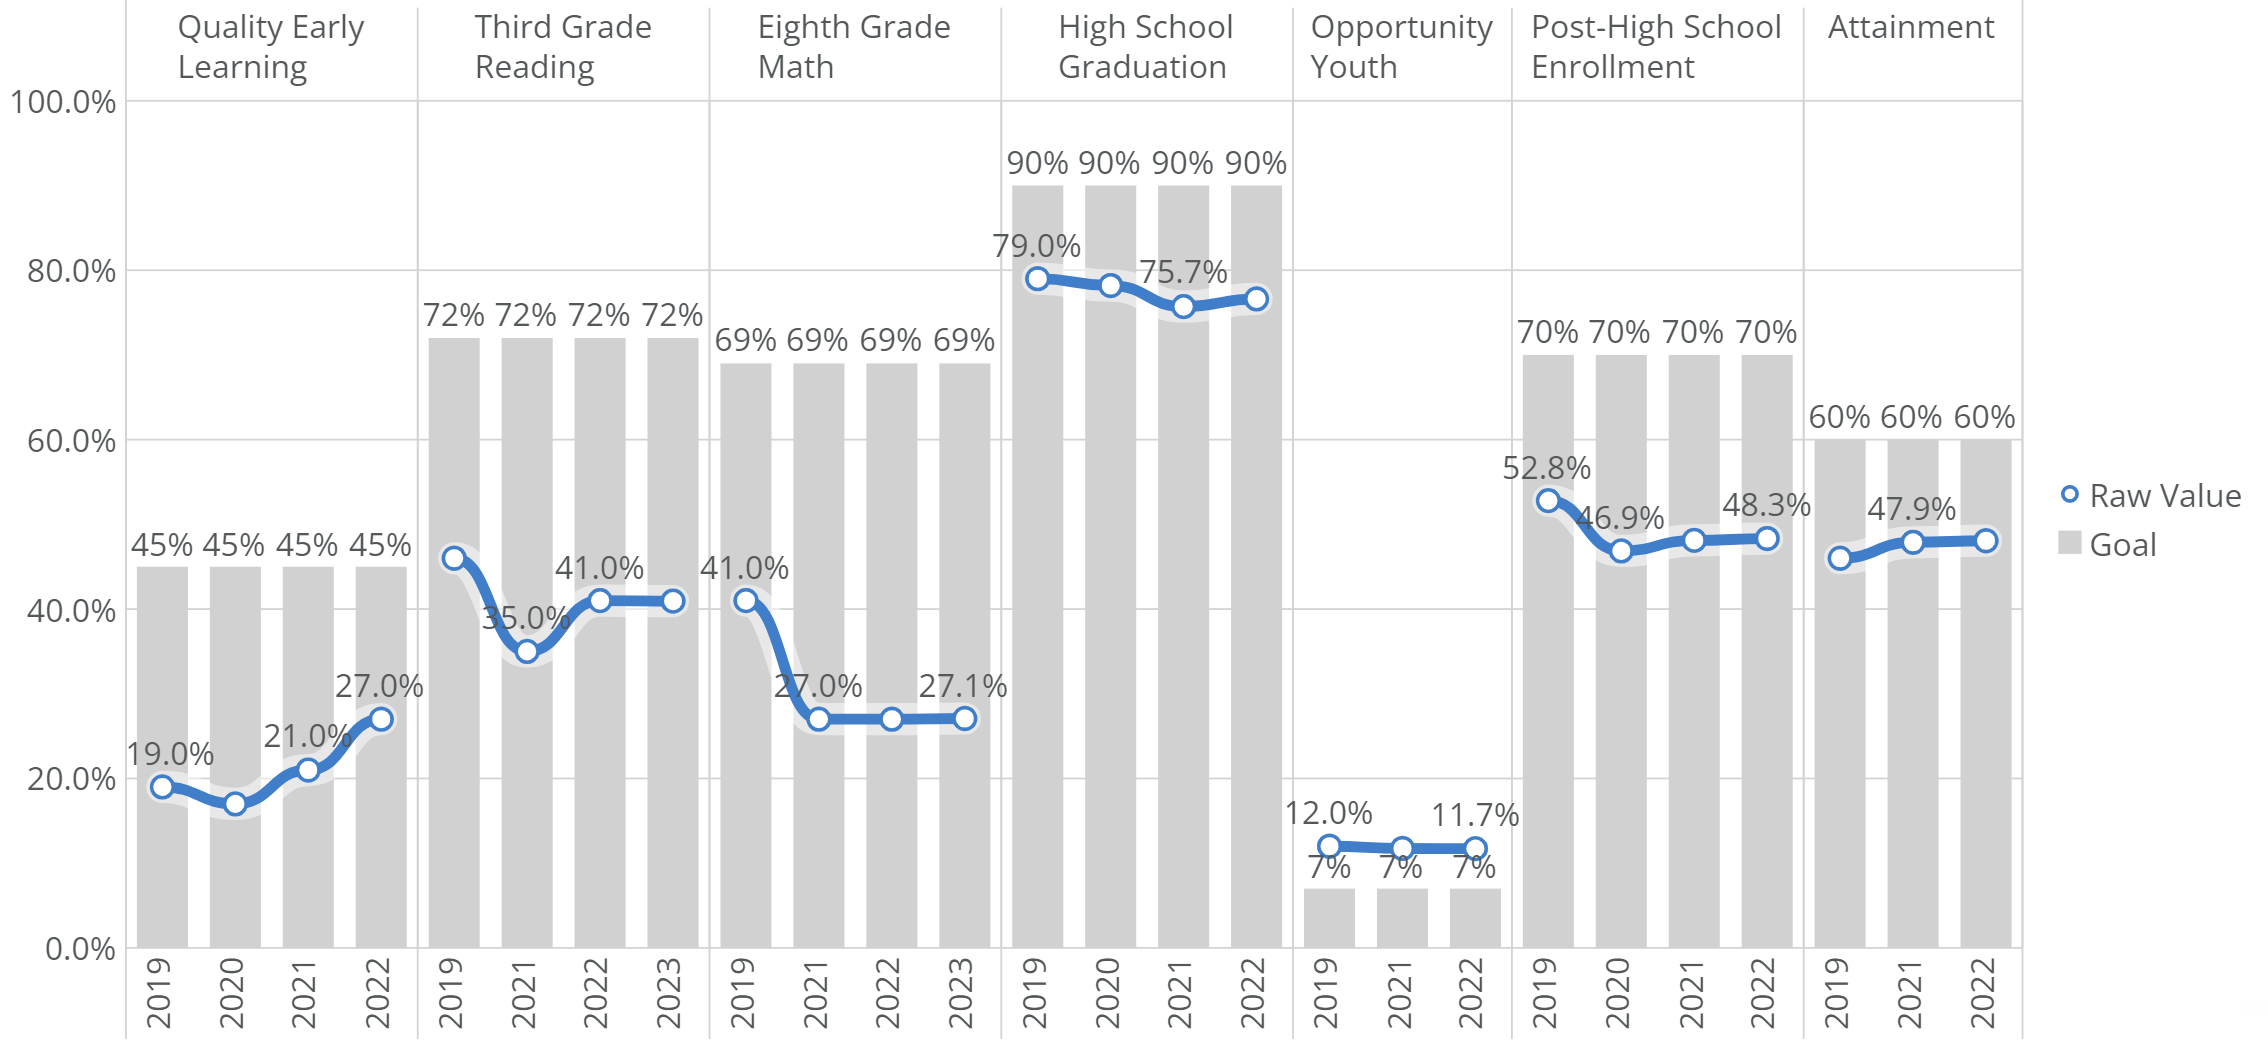
Figure 2: Four-year trend - Arizona's education system showing little progress in the most recent Arizona Education Progress Meter update.
Figures 3 and 4 indicate recent trends for subgroups of students and can provide more specific insight. Figure 3 demonstrates that the challenges faced by Arizona’s students are not unique to any particular race or ethnicity, and the COVID-19 pandemic has impacted all. In contrast, Figure 4 explores non-race or -ethnic subgroups like disability and economic status. Some general observations on each indicator are below that provide a very brief glimpse into how students of different demographics are doing:
- Quality Early Learning showed a significant increase and points to a need for exploring the context and potential factors for improvement. For example, a substantial federal investment into pre-kindergarten education from the Arizona Department of Economic Security during the reported data timeframe resulted in about 800 additional quality first programs and funded childcare for families, including additional reimbursement to high-quality programs. No disaggregated data are available for this metric.
- Third-Grade Reading remained at 41% passing rate: Notable increases to the goal were seen for students identifying as Asian, Two or More Races, Native Hawaiian/Other Pacific Islander, or African American. Students in foster care saw improvement from 2022 to 2023, but other categories did not have a notable improvement.
- Eighth-Grade Math remained at a 27% passing rate: Students identifying as Asian, White, Two or More Races, Native Hawaiian/Other Pacific Islander, African American, or Native American realized a 1-point increase. Students with disabilities, migrants, and those who are economically disadvantaged saw year-over-year declines, while students in foster care and experiencing homelessness saw slight gains in this metric.
- High School Graduation increased by 1 point to 77%: Students identifying as Hispanic or Latino, Two or More Races, African American, or Native American showed slight increases, while Asian and White students remained the same. Native Hawaiian/Other Pacific Islander students saw a slight decline. The most notable improvement was seen among Limited English Proficient students, which jumped significantly from 55% to 69%, while students with a disability and who are economically disadvantaged show a slight increase.
- Opportunity Youth remained at 12%: This is the only metric where a decline is a positive indicator; the goal is to reduce the number of 16-24-year-olds not working or in school. White Arizonans reached the goal of 7% for this metric, and Native Americans saw a slight decrease from 28% to 27%. Young people identifying as African American and Other Race and Ethnicities show an increase.
- Post-High School Enrollment remained at 48%: Among students identifying as White or Hispanic or Latino, enrollment increased slightly while it decreased for those who are Native American and African American. Students who identify as economically disadvantaged, have limited English proficiency, or experience a disability all had slight increases.
- Post-Secondary Attainment remained at 48%: Demographic data are limited for this metric, but there was a slight improvement in White and Hispanic or Latino attainment levels. Other disaggregated data are not available.
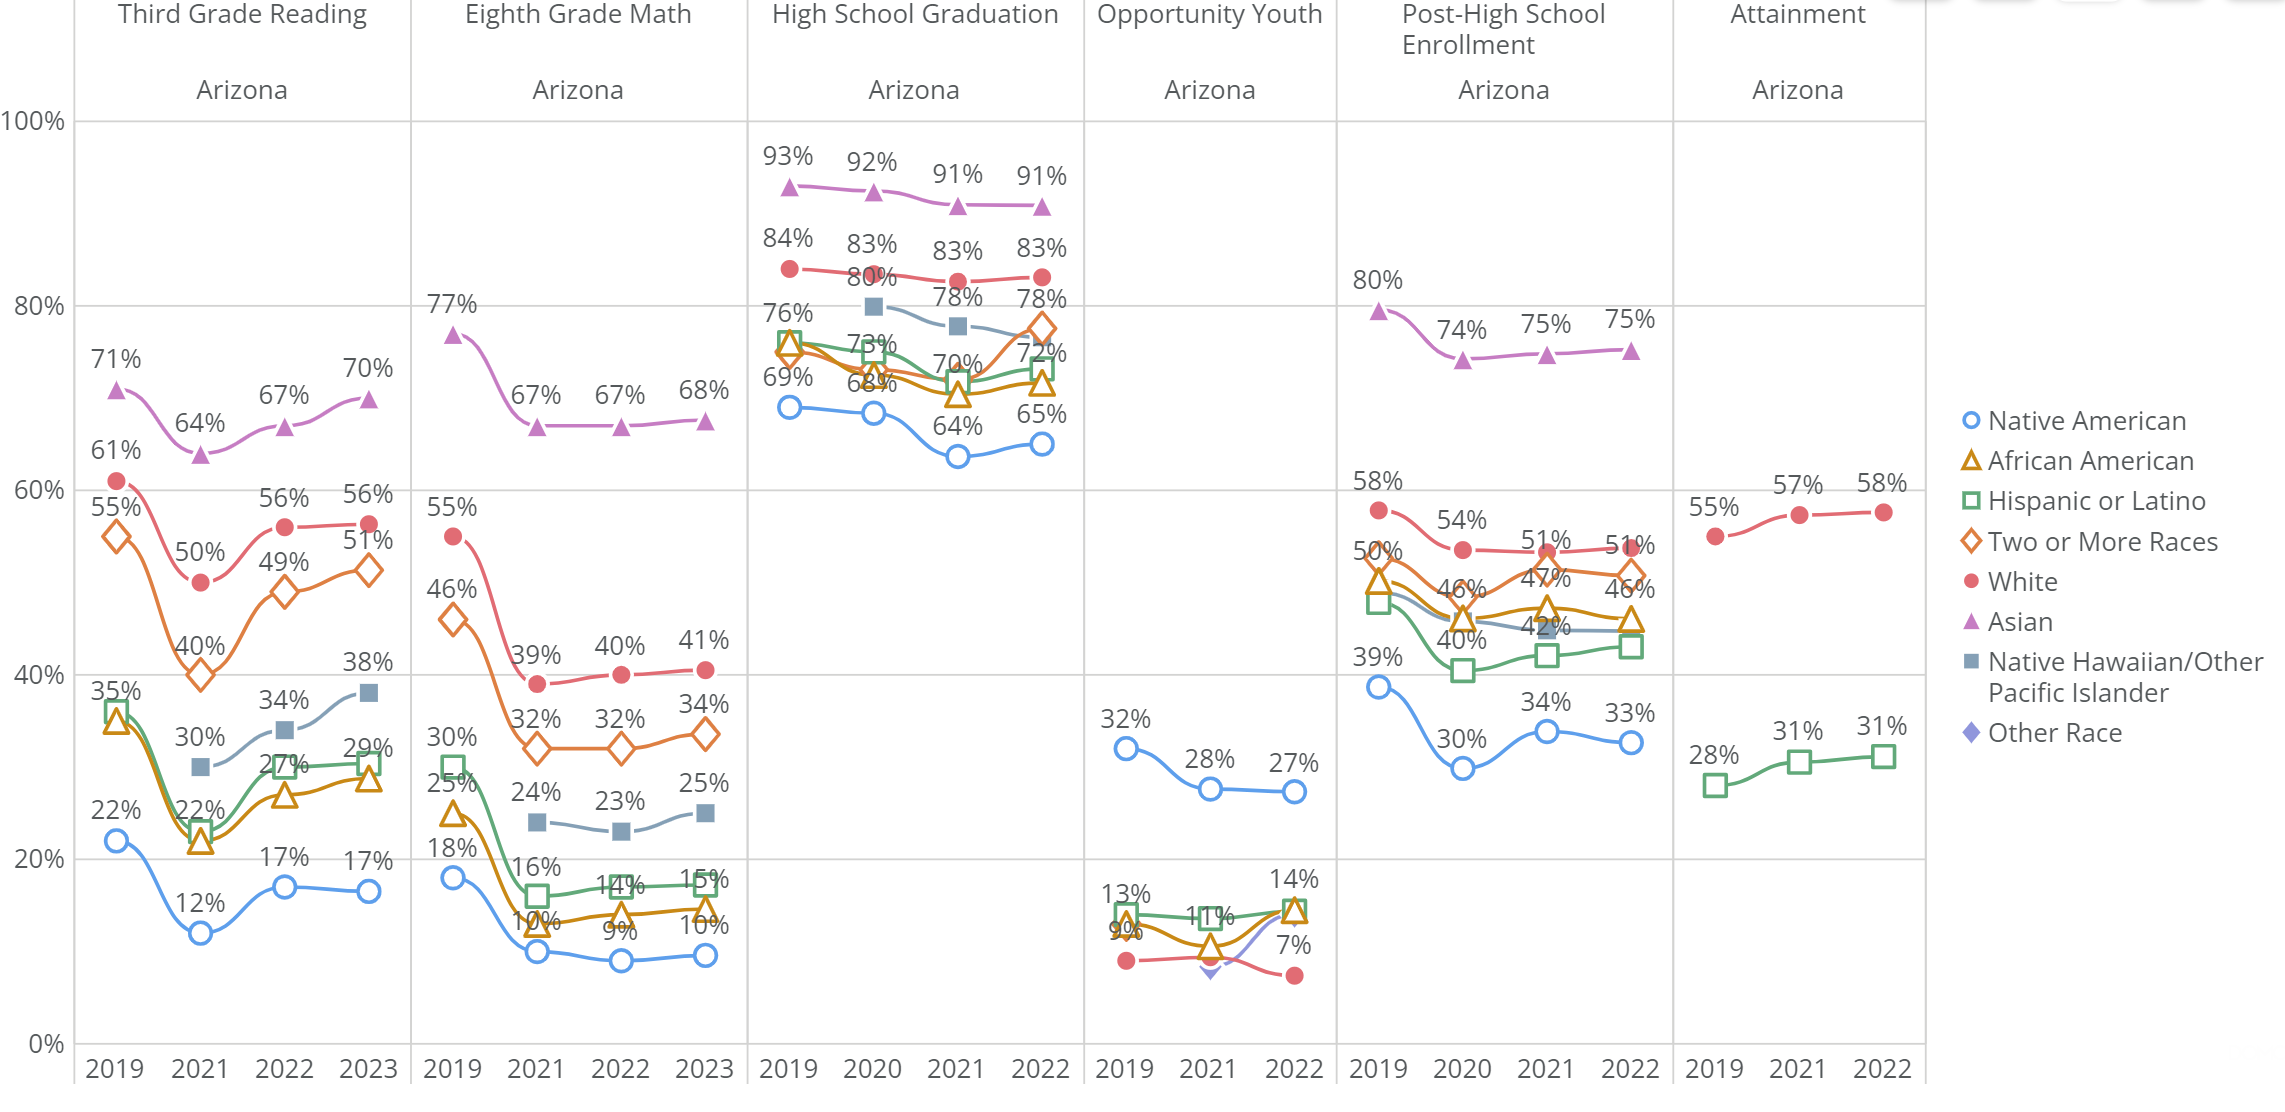
Figure 3: Disaggregated data by race and ethnicity indicate that recovery from post-COVID learning loss is a challenge across demographics. (State testing did not occur in 2020)
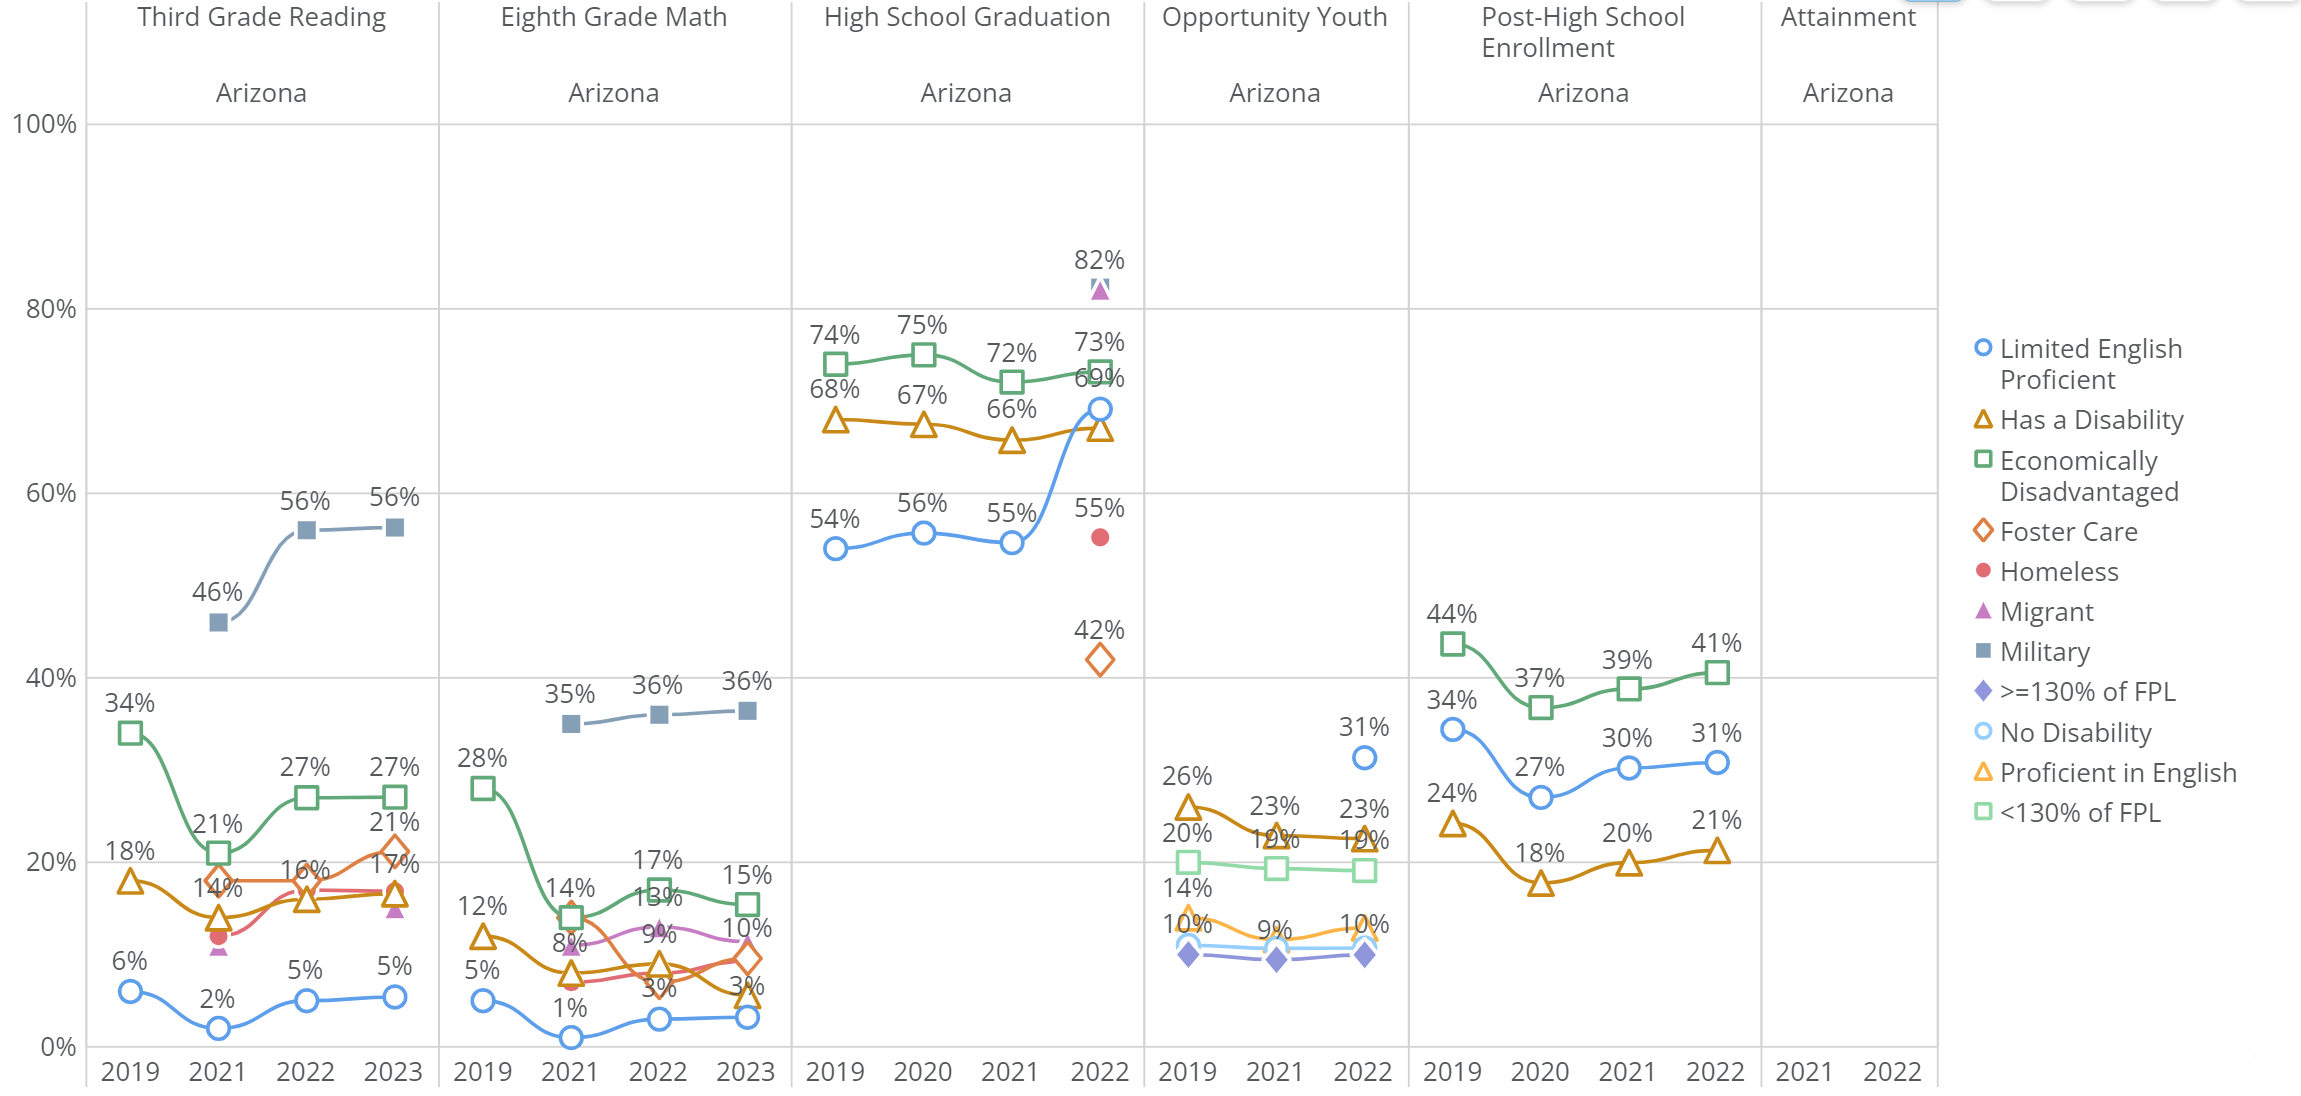
Figure 4: Data on various categories of students indicate similar challenges for many, along with a few bright spots, such as improvements in Third-Grade Reading for students in foster care. (State testing did not occur in 2020)
Among these data, it is apparent that Arizona students are seeing similar challenges and limited improvement in education outcomes. Continued emphasis on identifying challenges and creating solutions that improve outcomes for Arizona’s young people is critical to making progress toward the goals of the Arizona Education Progress Meter, which was developed and adopted throughout the education community to ensure that future generations of Arizonans are prepared to contribute to our growing economy and realize a high quality of life.
Moving Arizona Forward
In CFA’s polling and engagement within communities across Arizona over the last 15 years, education remains a top priority and consistently is cited as one of the most critical issues that need to be addressed. Arizonans not only understand the key and central role education plays in their own success but overwhelmingly support concerted action to advance the success and prosperity of Arizona through educational attainment.
CFA’s research specifically shows that a broad and representative majority of Arizonans agree on several actions to improve education and ensure every Arizonan is prepared for success in life and work. These supported actions include:
- Expanding access to quality preschool programs
- Ensuring every school has enough highly qualified teachers and principals
- Closing gaps in educational outcomes for vulnerable populations
- Increase the number of high school graduates going to college
- Reduce the financial barriers to going to college
Additionally, a January 2024 poll from Education Forward Arizona firmly underscores that Arizonans see education as a top priority and value education and training beyond high school as vital to quality of life.
The importance of responding to the will of Arizonans at this moment isn't just about academic attainment; it's about equipping all our people with skills that propel our state forward in all sectors. This is why CFA is focused on informing leaders and communities, convening partnerships, and implementing statewide programs to advance Arizonans’ priorities, including:
- Bringing together industry and education to provide seamless college & career pathways for students with quality career exploration, early college programs of study, and work-based learning
- Empowering and supporting educators with reimagining classroom learning
- Strengthening school and district leaders and the leaders guiding workforce development
Together, we stand at a pivotal moment. The time for accelerating action is now. Let's seize this opportunity to create a brighter future for all who live here.
Dig Deeper – Analyze Data to Support Investment and Action
Data are available for all Arizona public and charter schools, districts, cities, counties, and the state as a whole.
- Learn more and find all data and tools at the Arizona Education Progress Meter
- Post-Secondary Completion data is located at the bottom of Post-Secondary Attainment
- Compare data using this dashboard specific to post-secondary enrollment and completion
Contact our team if you have questions or need assistance with the data tools.
About Our Data Sources
As with all the Arizona Progress Meters, data are publicly available from a trusted and regularly updated source. Data used in the education metrics come from the Arizona Department of Education, the U.S. Census Bureau, the Arizona Board of Regents, and the U.S. Student Clearinghouse. For more information, see our full methodology.
About Arizona Progress Meters
CFA developed the Arizona Progress Meters as a tool for policymakers, business leaders, civic leaders, educators, and others across the state to understand how Arizona is doing in areas critical to achieving The Arizona We Want. The Arizona Education Progress Meter was co-developed with Education Forward Arizona. All eight Arizona Progress Meters provide valuable and regularly updated data on 80+ metrics in education, jobs, healthcare, environment, civic engagement, infrastructure, and more to support policymakers and other leaders’ data-driven dialogue, decision-making, and action. Learn more and leverage all the Arizona Progress Meters today >>