The Arizona Voters’ Agenda provides valuable information about the priorities that the majority of voters across ages and political affiliations agree on and want their leaders to address. The findings reveal additional insights into what voters think about elections, how they select representatives, what the top issues are, and perspectives on key issues.
2022 KEY INSIGHTS
In response to open-ended and multiple-choice questions about priorities, the topics of immigration, economy, education, and water appear among the top of Arizona voters’ priorities that will guide their decisions in both Arizona Voters’ Agenda surveys. Also among the top of the most recent survey are abortion and election issues.
- Top issue guiding decision-making
The Arizona Voters’ Agenda surveys began by letting voters share the priorities on their minds. Responses to the open-ended question, “Thinking about the November election, what is the top issue or policy position that will guide you in your decision-making on selecting candidates to vote for?” revealed priorities including immigration, economy, abortion, education, elections, and water. - Top issue facing the state
Arizona voters’ views on the top issue facing the state today are consistent with where they were earlier this year before the primary. Immigration, economy & inflation, education, and long-term water supplies continue to top the list of the top issue facing the state.
A NEED TO TALK ABOUT VOTERS’ MOST IMPORTANT ISSUES
In regards to the 2022 midterm election, less than half of likely voters say candidates are talking about what’s important to them, and a surprising number of voters aren’t sure.
- Are current Arizona candidates for statewide and legislative offices talking about the most important issues to you? All Likely Voters: 44% no; 43% yes; 13% don’t know.
A DESIRE FOR WORKING ACROSS THE AISLE
- Nearly two-thirds of voters prefer candidates who are willing to compromise and work across the aisle to get things done.
Voters were asked to select the statement closest to their own opinion: Prefer candidates who are committed to their principles and will fight for what they believe is right and refuse to compromise; or, Prefer candidates who are willing to compromise and work across the aisle to find bipartisan solutions to complex problems.
- 64% of all likely voters prefer candidates who are willing to compromise
- 29% of all likely voters prefer candidates who refuse to compromise
VOTERS BELIEVE ELECTIONS ARE FAIR, SECURE, ACCURATE
- 74% of all voters rate Arizona Elections as fair – this includes 65% Republicans, 68% independent/unaffiliated voters, 89% Democrats.
- 70% of all voters rate Arizona elections as secure – this includes 54% Republicans, 63% independent/unaffiliated voters, 93% Democrats.
- 80% of all voters are confident in the accuracy of the results of the recent August Primary Election – this includes 70% Republicans, 75% independent/unaffiliated voters, 93% Democrats.
- 77% of all voters are confident that the results of the November General Election will be accurate – this includes 66% Republicans, 70% independent/unaffiliated voters, and 90%, Democrats.
VOTERS WANT POSITIONS AND SOLUTIONS
In response to the question, “When it comes to selecting a candidate to vote for, which of the following is the top factor that helps you to make your decision?” nearly two-thirds of all likely voters will choose candidates on their plans and where they stand on key issues, and rank ideology much lower:
- 38% Position on the issues
- 27% Has clear plans or solutions
- 12% Ideology
- 10% Party registration
- 7% Trust
- 3% Other
POST-ELECTION: LEADERS CAN DO MORE TO FOCUS ON VOTERS’ PRIORITIES
In an April 2023 poll after the election, less than a quarter of registered voters say elected leaders are focused on the most important issues.
Do you agree or disagree with the following statement, “The elected leaders in our state are focused on the issues that matter most to me”?
All Voters: 23% Agree (19 % Somewhat + 4% Strongly); 51% Disagree (28% Somewhat + 23% Strongly); 26% Unknown (20% Neutral + 6% Don’t Know)
POST-ELECTION: LEADERS CAN DO MORE TO WORK ACROSS THE AISLE
In an April 2023 poll after the election, only a quarter of registered voters say elected leaders are working across the aisle to develop solutions to important issues.
Do you agree or disagree with the following statement, “The elected leaders in our state, specifically the Arizona Legislature and Governor, are working across party lines to develop solutions to problems that matter most to me”?
All Voters: 25% Agree (20% Somewhat + 5% Strongly); 48% Disagree (22% Somewhat + 26% Strongly); 27% Unknown (20% Neutral + 7% Don’t Know)
2022 ARIZONA VOTERS' AGENDA: PRIORITIES BY TOPIC
Despite polarized political dialogue, there is significant agreement and common ground among voters on many public policy issues.
The Arizona Voters’ Agenda comprises specific policy items and values statements that a majority of voters across political affiliations and age groups agree are important issues facing the state.
The Arizona Voters’ Agenda built on where a majority across political and age groups agree and reflects what they care about most. Issues on the Arizona Voters’ Agenda meet all of the following criteria:
- “Strongly Agree/Support” is 50% and above among All Likely Voters
- Total Support (i.e., the sum of "Somewhat Agree/Support" and "Strongly Agree/ Support") is 50% and above among every political affiliation and age group
Printable Report I Infographic
- Read the June release with analysis of the Education findings.
- Big Question for Candidates: “What is your plan to ensure that Arizona students have quality teachers and principals?”
Policy Items
Ensuring that Arizona schools have quality teachers and principals.
| All Respondents | Republican | IND/Oth. | Democrat | Age 20-29 | Age 30-39 | Age 40-49 | Age 50-64 | Age 65+ | |
|---|---|---|---|---|---|---|---|---|---|
| Strongly Support | Total Support | Total Support | Total Support | Total Support | Total Support | Total Support | Total Support | Total Support | Total Support |
| 89% | 97% | 96% | 95% | 98% | 93% | 98% | 100% | 96% | 96% |
Expanding career and technical education opportunities.
| All Respondents | Republican | IND/Oth. | Democrat | Age 20-29 | Age 30-39 | Age 40-49 | Age 50-64 | Age 65+ | |
|---|---|---|---|---|---|---|---|---|---|
| Strongly Support | Total Support | Total Support | Total Support | Total Support | Total Support | Total Support | Total Support | Total Support | Total Support |
| 78% | 97% | 96% | 100% | 98% | 98% | 100% | 96% | 96% | 96% |
Increasing teacher pay.
| All Respondents | Republican | IND/Oth. | Democrat | Age 20-29 | Age 30-39 | Age 40-49 | Age 50-64 | Age 65+ | |
|---|---|---|---|---|---|---|---|---|---|
| Strongly Support | Total Support | Total Support | Total Support | Total Support | Total Support | Total Support | Total Support | Total Support | Total Support |
| 72% | 88% | 80% | 90% | 98% | 95% | 90% | 90% | 85% | 86% |
Increasing the number of Arizona students who pursue and complete education or training beyond high school (including university, community college or technical/trade school).
| All Respondents | Republican | IND/Oth. | Democrat | Age 20-29 | Age 30-39 | Age 40-49 | Age 50-64 | Age 65+ | |
|---|---|---|---|---|---|---|---|---|---|
| Strongly Support | Total Support | Total Support | Total Support | Total Support | Total Support | Total Support | Total Support | Total Support | Total Support |
| 70% | 94% | 90% | 98% | 99% | 98% | 92% | 100% | 94% | 89% |
Increasing funding for K-12 public education.
| All Respondents | Republican | IND/Oth. | Democrat | Age 20-29 | Age 30-39 | Age 40-49 | Age 50-64 | Age 65+ | |
|---|---|---|---|---|---|---|---|---|---|
| Strongly Support | Total Support | Total Support | Total Support | Total Support | Total Support | Total Support | Total Support | Total Support | Total Support |
| 65% | 82% | 69% | 90% | 97% | 92% | 82% | 82% | 84% | 78% |
Reducing financial barriers for students going to college.
| All Respondents | Republican | IND/Oth. | Democrat | Age 20-29 | Age 30-39 | Age 40-49 | Age 50-64 | Age 65+ | |
|---|---|---|---|---|---|---|---|---|---|
| Strongly Support | Total Support | Total Support | Total Support | Total Support | Total Support | Total Support | Total Support | Total Support | Total Support |
| 58% | 80% | 65% | 90% | 98% | 88% | 82% | 87% | 79% | 74% |
Closing gaps in educational outcomes for vulnerable populations, including low-income, those with disabilities, and English language learners.
| All Respondents | Republican | IND/Oth. | Democrat | Age 20-29 | Age 30-39 | Age 40-49 | Age 50-64 | Age 65+ | |
|---|---|---|---|---|---|---|---|---|---|
| Strongly Support | Total Support | Total Support | Total Support | Total Support | Total Support | Total Support | Total Support | Total Support | Total Support |
| 58% | 83% | 71% | 90% | 95% | 90% | 85% | 92% | 79% | 78% |
Increasing access and affordability of early learning for 3 and 4-year-olds.
| All Respondents | Republican | IND/Oth. | Democrat | Age 20-29 | Age 30-39 | Age 40-49 | Age 50-64 | Age 65+ | |
|---|---|---|---|---|---|---|---|---|---|
| Strongly Support | Total Support | Total Support | Total Support | Total Support | Total Support | Total Support | Total Support | Total Support | Total Support |
| 52% | 78% | 66% | 85% | 90% | 93% | 82% | 82% | 77% | 70% |
Value Statements
Every school should have the resources necessary to deliver quality education that prepares every child for the future, no matter their skin color, background, or zip code.
| All Respondents | Republican | IND/Oth. | Democrat | Age 20-29 | Age 30-39 | Age 40-49 | Age 50-64 | Age 65+ | |
|---|---|---|---|---|---|---|---|---|---|
| Strongly Support | Total Support | Total Support | Total Support | Total Support | Total Support | Total Support | Total Support | Total Support | Total Support |
| 88% | 97% | 95% | 100% | 98% | 98% | 98% | 99% | 96% | 96% |
Closing achievement gaps among our students is important to ensuring our state can produce the skilled workforce necessary for a strong economic future for Arizona.
| All Respondents | Republican | IND/Oth. | Democrat | Age 20-29 | Age 30-39 | Age 40-49 | Age 50-64 | Age 65+ | |
|---|---|---|---|---|---|---|---|---|---|
| Strongly Support | Total Support | Total Support | Total Support | Total Support | Total Support | Total Support | Total Support | Total Support | Total Support |
| 61% | 86% | 80% | 90% | 94% | 90% | 87% | 90% | 84% | 83% |
CFA coordinated with Education Forward Arizona (EFA), who conducted an additional poll to gain deeper insights into the priorities of likely Arizona voters on education, recognizing education is consistently one of the top issues for Arizonans. Learn more about the findings at educationforwardarizona.org.
- Read the June release with analysis of the Economy & Inflation findings.
- Read the September release with additional findings on State Spending.
- Big Questions for Candidates:
“What do you think the state should do with the surplus?”
“Do you believe Arizona should prioritize cutting taxes or continue investing in critical infrastructure to keep up with growth, and why?”
Policy Items
Supporting Arizona's long-term economic growth.
| All Respondents | Republican | IND/Oth. | Democrat | Age 20-29 | Age 30-39 | Age 40-49 | Age 50-64 | Age 65+ | |
|---|---|---|---|---|---|---|---|---|---|
| Strongly Support | Total Support | Total Support | Total Support | Total Support | Total Support | Total Support | Total Support | Total Support | Total Support |
| 76% | 95% | 95% | 98% | 95% | 95% | 93% | 96% | 95% | 94% |
Addressing inflation.
| All Respondents | Republican | IND/Oth. | Democrat | Age 20-29 | Age 30-39 | Age 40-49 | Age 50-64 | Age 65+ | |
|---|---|---|---|---|---|---|---|---|---|
| Strongly Support | Total Support | Total Support | Total Support | Total Support | Total Support | Total Support | Total Support | Total Support | Total Support |
| 75% | 92% | 95% | 93% | 88% | 93% | 92% | 91% | 95% | 90% |
Addressing rising costs.
| All Respondents | Republican | IND/Oth. | Democrat | Age 20-29 | Age 30-39 | Age 40-49 | Age 50-64 | Age 65+ | |
|---|---|---|---|---|---|---|---|---|---|
| Strongly Support | Total Support | Total Support | Total Support | Total Support | Total Support | Total Support | Total Support | Total Support | Total Support |
| 69% | 88% | 88% | 88% | 89% | 93% | 92% | 87% | 91% | 83% |
Reducing gas prices.
| All Respondents | Republican | IND/Oth. | Democrat | Age 20-29 | Age 30-39 | Age 40-49 | Age 50-64 | Age 65+ | |
|---|---|---|---|---|---|---|---|---|---|
| Strongly Support | Total Support | Total Support | Total Support | Total Support | Total Support | Total Support | Total Support | Total Support | Total Support |
| 69% | 87% | 93% | 83% | 79% | 90% | 87% | 87% | 88% | 84% |
Increasing housing affordability.
| All Respondents | Republican | IND/Oth. | Democrat | Age 20-29 | Age 30-39 | Age 40-49 | Age 50-64 | Age 65+ | |
|---|---|---|---|---|---|---|---|---|---|
| Strongly Support | Total Support | Total Support | Total Support | Total Support | Total Support | Total Support | Total Support | Total Support | Total Support |
| 68% | 88% | 84% | 88% | 94% | 98% | 92% | 84% | 85% | 88% |
Increasing job creation and business investment.
| All Respondents | Republican | IND/Oth. | Democrat | Age 20-29 | Age 30-39 | Age 40-49 | Age 50-64 | Age 65+ | |
|---|---|---|---|---|---|---|---|---|---|
| Strongly Support | Total Support | Total Support | Total Support | Total Support | Total Support | Total Support | Total Support | Total Support | Total Support |
| 67% | 92% | 95% | 88% | 91% | 93% | 98% | 92% | 91% | 90% |
Value Statements
New To keep up with growth, we need to make ongoing investments in education, our transportation system, public safety, and other critical infrastructure.
| All Respondents | Republican | IND/Oth. | Democrat | Age 20-29 | Age 30-39 | Age 40-49 | Age 50-64 | Age 65+ | |
|---|---|---|---|---|---|---|---|---|---|
| Strongly Support | Total Support | Total Support | Total Support | Total Support | Total Support | Total Support | Total Support | Total Support | Total Support |
| 61% | 89% | 81% | 93% | 96% | 97% | 90% | 91% | 84% | 88% |
In regards to Arizona's budget surplus: Instead of continuing to cut taxes, we should be increasing funding for education, public safety, roads, and other critical investments that will boost our long-term economic growth.
| All Respondents | Republican | IND/Oth. | Democrat | Age 20-29 | Age 30-39 | Age 40-49 | Age 50-64 | Age 65+ | |
|---|---|---|---|---|---|---|---|---|---|
| Strongly Support | Total Support | Total Support | Total Support | Total Support | Total Support | Total Support | Total Support | Total Support | Total Support |
| 54% | 82% | 70% | 93% | 95% | 92% | 72% | 80% | 80% | 84% |
When you compare Arizona to other states across the country, our tax burden is relatively low. Everyone should pay their fair share of taxes to ensure that the state can continue to meet its core obligations.
| All Respondents | Republican | IND/Oth. | Democrat | Age 20-29 | Age 30-39 | Age 40-49 | Age 50-64 | Age 65+ | |
|---|---|---|---|---|---|---|---|---|---|
| Strongly Support | Total Support | Total Support | Total Support | Total Support | Total Support | Total Support | Total Support | Total Support | Total Support |
| 51% | 84% | 78% | 90% | 92% | 86% | 73% | 76% | 86% | 89% |
- Read the June release of Water and Environment findings.
- Read the September release with new insights on Water and Environment
- Big Questions for Candidates:
“What should Arizona do to protect our water future and secure our long-term water supplies?”
“How should Arizona invest in securing our water future, cleaner air, energy improvement in rural areas, protecting our electric grid, and managing our forests?”
Policy Items
Securing Arizona's water future and addressing our long-term drought.
| All Respondents | Republican | IND/Oth. | Democrat | Age 20-29 | Age 30-39 | Age 40-49 | Age 50-64 | Age 65+ | |
|---|---|---|---|---|---|---|---|---|---|
| Strongly Support | Total Support | Total Support | Total Support | Total Support | Total Support | Total Support | Total Support | Total Support | Total Support |
| 83% | 95% | 94% | 93% | 98% | 100% | 97% | 96% | 94% | 94% |
Preserving and protecting Arizona's rivers, natural areas, and wildlife.
| All Respondents | Republican | IND/Oth. | Democrat | Age 20-29 | Age 30-39 | Age 40-49 | Age 50-64 | Age 65+ | |
|---|---|---|---|---|---|---|---|---|---|
| Strongly Support | Total Support | Total Support | Total Support | Total Support | Total Support | Total Support | Total Support | Total Support | Total Support |
| 80% | 96% | 93% | 95% | 99% | 100% | 92% | 96% | 94% | 97% |
Increasing investments and measures to prevent forest fires on state land.
| All Respondents | Republican | IND/Oth. | Democrat | Age 20-29 | Age 30-39 | Age 40-49 | Age 50-64 | Age 65+ | |
|---|---|---|---|---|---|---|---|---|---|
| Strongly Support | Total Support | Total Support | Total Support | Total Support | Total Support | Total Support | Total Support | Total Support | Total Support |
| 71% | 93% | 90% | 93% | 95% | 93% | 92% | 92% | 91% | 94% |
Improving air quality.
| All Respondents | Republican | IND/Oth. | Democrat | Age 20-29 | Age 30-39 | Age 40-49 | Age 50-64 | Age 65+ | |
|---|---|---|---|---|---|---|---|---|---|
| Strongly Support | Total Support | Total Support | Total Support | Total Support | Total Support | Total Support | Total Support | Total Support | Total Support |
| 62% | 88% | 80% | 98% | 99% | 95% | 90% | 87% | 85% | 88% |
Investing available funding to address environmental and water issues, including drought resiliency, clean air, energy improvement in rural areas, electric grid resiliency, and forest fires.
| All Respondents | Republican | IND/Oth. | Democrat | Age 20-29 | Age 30-39 | Age 40-49 | Age 50-64 | Age 65+ | |
|---|---|---|---|---|---|---|---|---|---|
| Strongly Support | Total Support | Total Support | Total Support | Total Support | Total Support | Total Support | Total Support | Total Support | Total Support |
| 55% | 85% | 75% | 88% | 95% | 88% | 92% | 90% | 81% | 83% |
Value Statements
We need to do something to protect our water future and secure our long-term water supplies.
| All Respondents | Republican | IND/Oth. | Democrat | Age 20-29 | Age 30-39 | Age 40-49 | Age 50-64 | Age 65+ | |
|---|---|---|---|---|---|---|---|---|---|
| Strongly Support | Total Support | Total Support | Total Support | Total Support | Total Support | Total Support | Total Support | Total Support | Total Support |
| 74% | 94% | 89% | 98% | 99% | 97% | 95% | 92% | 93% | 93% |
We must support sustainable practices that protect our air, land, and water, and foster a high quality of life for all.
| All Respondents | Republican | IND/Oth. | Democrat | Age 20-29 | Age 30-39 | Age 40-49 | Age 50-64 | Age 65+ | |
|---|---|---|---|---|---|---|---|---|---|
| Strongly Support | Total Support | Total Support | Total Support | Total Support | Total Support | Total Support | Total Support | Total Support | Total Support |
| 65% | 90% | 80% | 93% | 100% | 98% | 88% | 91% | 89% | 88% |
- Read the June release with analysis of the Elections findings.
- Big Question for Candidates:
“What should Arizona do to keep our elections secure while preventing barriers to participation?”
Policy Items
Ensuring that all candidates, regardless of party affiliation, have the same signature requirements to qualify for a particular elected office.
| All Respondents | Republican | IND/Oth. | Democrat | Age 20-29 | Age 30-39 | Age 40-49 | Age 50-64 | Age 65+ | |
|---|---|---|---|---|---|---|---|---|---|
| Strongly Support | Total Support | Total Support | Total Support | Total Support | Total Support | Total Support | Total Support | Total Support | Total Support |
| 67% | 87% | 92% | 85% | 82% | 92% | 85% | 86% | 86% | 88% |
Offering early in-person voting over multiple weeks leading up to Election Day.
| All Respondents | Republican | IND/Oth. | Democrat | Age 20-29 | Age 30-39 | Age 40-49 | Age 50-64 | Age 65+ | |
|---|---|---|---|---|---|---|---|---|---|
| Strongly Support | Total Support | Total Support | Total Support | Total Support | Total Support | Total Support | Total Support | Total Support | Total Support |
| 55% | 74% | 60% | 75% | 93% | 85% | 75% | 80% | 78% | 63% |
Value Statement
We can do more to secure our elections system and protect it from outside interference and fraudulent voting. At the same time, we must make sure that it remains easy to vote – and not create barriers to participation that disproportionately hurt certain communities.
| All Respondents | Republican | IND/Oth. | Democrat | Age 20-29 | Age 30-39 | Age 40-49 | Age 50-64 | Age 65+ | |
|---|---|---|---|---|---|---|---|---|---|
| Strongly Support | Total Support | Total Support | Total Support | Total Support | Total Support | Total Support | Total Support | Total Support | Total Support |
| 61% | 87% | 86% | 85% | 91% | 93% | 87% | 85% | 85% | 88% |
- Read the June release with analysis of the Immigration findings.
- Big Question for Candidates: “How do you define a functioning border for commerce, and what is your vision for immigration reform?”
Policy Items
Creating a functioning border for commerce and immigration.
| All Respondents | Republican | IND/Oth. | Democrat | Age 20-29 | Age 30-39 | Age 40-49 | Age 50-64 | Age 65+ | |
|---|---|---|---|---|---|---|---|---|---|
| Strongly Support | Total Support | Total Support | Total Support | Total Support | Total Support | Total Support | Total Support | Total Support | Total Support |
| 64% | 87% | 84% | 90% | 89% | 86% | 90% | 89% | 87% | 84% |
Creating a pathway to citizenship for DACA recipients and dreamers who were brought to Arizona as children.
| All Respondents | Republican | IND/Oth. | Democrat | Age 20-29 | Age 30-39 | Age 40-49 | Age 50-64 | Age 65+ | |
|---|---|---|---|---|---|---|---|---|---|
| Strongly Support | Total Support | Total Support | Total Support | Total Support | Total Support | Total Support | Total Support | Total Support | Total Support |
| 61% | 83% | 67% | 90% | 98% | 92% | 88% | 85% | 79% | 79% |
Enacting comprehensive immigration reform that includes a pathway to citizenship.
| All Respondents | Republican | IND/Oth. | Democrat | Age 20-29 | Age 30-39 | Age 40-49 | Age 50-64 | Age 65+ | |
|---|---|---|---|---|---|---|---|---|---|
| Strongly Support | Total Support | Total Support | Total Support | Total Support | Total Support | Total Support | Total Support | Total Support | Total Support |
| 60% | 81% | 70% | 95% | 92% | 93% | 88% | 89% | 76% | 76% |
Value Statement
Immigration reform will ultimately strengthen the country. Mexico is Arizona's largest trading partner; we need to get serious about supporting comprehensive immigration reform because it will strengthen our economy and promote border security.
| All Respondents | Republican | IND/Oth. | Democrat | Age 20-29 | Age 30-39 | Age 40-49 | Age 50-64 | Age 65+ | |
|---|---|---|---|---|---|---|---|---|---|
| Strongly Support | Total Support | Total Support | Total Support | Total Support | Total Support | Total Support | Total Support | Total Support | Total Support |
| 53% | 81% | 73% | 88% | 92% | 86% | 87% | 85% | 79% | 76% |
- Read the official announcement with analysis of the Housing Affordability & Homelessness findings.
- Big Question for Candidates: “How do you propose to ensure all residents have access to housing that is safe and affordable?”
Policy Items
Increasing housing affordability.
| All Respondents | Republican | IND/Oth. | Democrat | Age 20-29 | Age 30-39 | Age 40-49 | Age 50-64 | Age 65+ | |
|---|---|---|---|---|---|---|---|---|---|
| Strongly Support | Total Support | Total Support | Total Support | Total Support | Total Support | Total Support | Total Support | Total Support | Total Support |
| 68% | 88% | 84% | 88% | 94% | 98% | 92% | 84% | 85% | 88% |
Encouraging workforce housing options for essential workers such as firefighters, police officers, teachers, and healthcare staff.
| All Respondents | Republican | IND/Oth. | Democrat | Age 20-29 | Age 30-39 | Age 40-49 | Age 50-64 | Age 65+ | |
|---|---|---|---|---|---|---|---|---|---|
| Strongly Support | Total Support | Total Support | Total Support | Total Support | Total Support | Total Support | Total Support | Total Support | Total Support |
| 51% | 78% | 66% | 70% | 91% | 85% | 80% | 83% | 75% | 74% |
Encouraging apartment developers to dedicate a few available units to families who qualify for housing assistance.
| All Respondents | Republican | IND/Oth. | Democrat | Age 20-29 | Age 30-39 | Age 40-49 | Age 50-64 | Age 65+ | |
|---|---|---|---|---|---|---|---|---|---|
| Strongly Support | Total Support | Total Support | Total Support | Total Support | Total Support | Total Support | Total Support | Total Support | Total Support |
| 51% | 78% | 66% | 78% | 97% | 82% | 76% | 81% | 75% | 79% |
Value Statement
House prices and rental rates are out of control. Many essential workers are not able to afford housing in the communities they serve.
| All Respondents | Republican | IND/Oth. | Democrat | Age 20-29 | Age 30-39 | Age 40-49 | Age 50-64 | Age 65+ | |
|---|---|---|---|---|---|---|---|---|---|
| Strongly Support | Total Support | Total Support | Total Support | Total Support | Total Support | Total Support | Total Support | Total Support | Total Support |
| 60% | 80% | 70% | 88% | 91% | 93% | 81% | 85% | 77% | 76% |
Landlords should not be allowed to keep a person out of housing based on how they pay for it – whether using their own funds or housing assistance.
| All Respondents | Republican | IND/Oth. | Democrat | Age 20-29 | Age 30-39 | Age 40-49 | Age 50-64 | Age 65+ | |
|---|---|---|---|---|---|---|---|---|---|
| Strongly Support | Total Support | Total Support | Total Support | Total Support | Total Support | Total Support | Total Support | Total Support | Total Support |
| 59% | 78% | 65% | 90% | 91% | 80% | 86% | 75% | 76% | 76% |
Arizona must do more to make sure that housing options are affordable and available to middle- and low-income earners throughout the state.
| All Respondents | Republican | IND/Oth. | Democrat | Age 20-29 | Age 30-39 | Age 40-49 | Age 50-64 | Age 65+ | |
|---|---|---|---|---|---|---|---|---|---|
| Strongly Support | Total Support | Total Support | Total Support | Total Support | Total Support | Total Support | Total Support | Total Support | Total Support |
| 57% | 79% | 62% | 88% | 98% | 88% | 88% | 78% | 77% | 76% |
State and local government have a role to play in making sure people who experience homelessness can access safe, affordable housing.
| All Respondents | Republican | IND/Oth. | Democrat | Age 20-29 | Age 30-39 | Age 40-49 | Age 50-64 | Age 65+ | |
|---|---|---|---|---|---|---|---|---|---|
| Strongly Support | Total Support | Total Support | Total Support | Total Support | Total Support | Total Support | Total Support | Total Support | Total Support |
| 52% | 83% | 71% | 83% | 98% | 95% | 85% | 85% | 81% | 78% |
BIG QUESTIONS FOR LEADERS TO ADDRESS TODAY
The Arizona Voters’ Agenda findings illuminate “big questions” based on where voters have the strongest agreement. We encourage leaders serving Arizonans to answer the call, and community members and the media to seek real answers and solutions from our state’s leaders.
EDUCATION
- What is your plan to ensure all Arizona students have quality teachers and principals?
- What should Arizona do to increase teacher pay?
- What should Arizona do to ensure every school has the resources they need to deliver quality education that prepares every child for the future?
- Get even more questions at educationforwardarizona.org/priorities.
ECONOMY, INFLATION & STATE SPENDING
- The State of Arizona continues to project a budget surplus. What do you think the state should do with
the surplus? - The Arizona Legislature passed a bipartisan budget in June 2022 that included investments of surplus dollars. Do you think additional investments are needed, and what would that look like?
- Do you believe Arizona should prioritize cutting taxes or continue investing in critical infrastructure to keep up with growth, and why?
- What investments should Arizona make in education, transportation, public safety, and other critical infrastructure to support growth?
WATER & ENVIRONMENT
- What should Arizona do to protect our water future and secure long-term water supplies?
- Should Arizona be planning for a future without Colorado River water?
- Is Arizona prepared to handle a water crisis? What more can we do to conserve, regulate, and secure additional water supplies?
- What sustainable practices should continue and be implemented to protect Arizona’s air, land, and water and foster a high quality of life for all?
- What more can be done to preserve and protect Arizona’s rivers, natural areas, and wildlife?
- How will you ensure Arizona makes sustainable gains on environmental concerns affecting everyday lives and economic vitality, such as forest fires and air quality?
- How should Arizona invest in securing our water future, cleaner air, energy improvement in rural areas, protecting our electric grid, and managing our forests?
ELECTIONS
- What should Arizona do to keep our elections secure while preventing barriers to participation?
- What can Arizona do to ensure that all candidates, regardless of party affiliation, have the same signature requirements to qualify to run for elected office?
- Do you support early and mail-in voting, and why or why not?
- Do you believe Arizona elections are fair & secure, and are you confident in the accuracy of the results of the midterm elections? Why or why not?
- What do you believe is the role of candidates and elected officials in engaging independent/unaffiliated voters?
- Do you think candidates and elected officials are more effective at delivering on the priorities of Arizonans when they fight for what they believe is right and refuse to compromise or when they are willing to compromise and work across the aisle to find bipartisan solutions to complex problems? Why?
IMMIGRATION
- How do you define a functioning border for commerce, and what is your vision for immigration reform?
- How should Arizona influence the Federal Government in creating a pathway to citizenship for DACA recipients and dreamers who were brought to Arizona as children?
- How do your immigration plans strengthen our business relationships with Mexico and our economy for the long term?
HOUSING AFFORDABILITY & HOMELESSNESS
- What should Arizona do to address inflation and rising costs and make housing more affordable?
- How do you propose to ensure all residents have access to housing that is safe and affordable?
- What can Arizona do to ensure developers and landlords support efforts to make affordable housing accessible?
About the Arizona Voters’ Agenda Surveys
Two Arizona Voters’ Agenda surveys were conducted among likely voters ahead of the 2022 midterm elections, on April 12-19, 2022, and August 20-24, 2022, with a random sample of 500 people for each survey. The polls surveyed likely Arizona 2022 General Election voters with a history of electoral participation and were balanced to model the likely turnout of voters across party, age, region, and gender. The live interview surveys of voters were conducted in English and Spanish by HighGround Public Affairs to landline and cell phone users. Based on previous midterm election trends, the partisan advantage was set at +8% GOP. The margin of error is ±4.3%.
Survey Demographics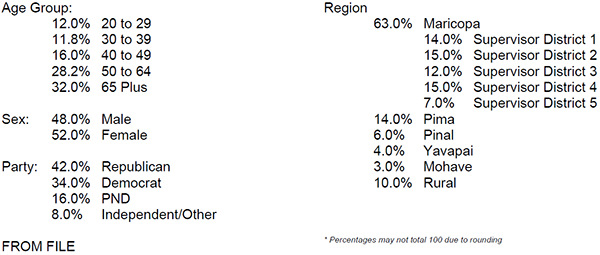
CFA sponsored questions in an additional Arizona Public Opinion Poll after the 2022 election. This poll was conducted as an online opt-in panel survey. The survey was completed by OH Predictive Insights April 4-11, 2023, from an Arizona Statewide Registered Voter sample. The sample demographics were weighted to accurately reflect the Arizona registered voter population by gender, region, age, party affiliation, ethnicity, and educational attainment according to statistics from a voter file derived from the Arizona Secretary of State’s office, as well as recent census data. The sample size was 1,000 completed surveys, with a margin of error of ± 3.1%.
Survey Demographics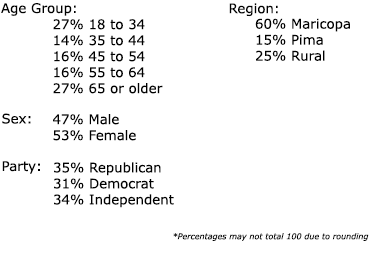
There are two surveys conducted during each election cycle to inform the Arizona Voters’ Agenda.
 |
Spring 2022 Survey Questions | |
| |
Fall 2022 Survey Questions | |