

Arizona Voters' Priorities Are Clear.
Every election cycle, Center for the Future of Arizona (CFA) conducts public opinion surveys of Republican, Democratic, and independent/unaffiliated likely voters to explore their perspectives on the election and issues facing the state. The Voters' Agenda focuses on what the vast majority of voters care about.
It offers a framework for understanding what voters want leaders to prioritize, the opportunities those priorities create for Arizona's future, and the questions they raise for candidates and leaders throughout the election.
Explore the research by topic below.
2026 Arizona Voters' Agenda Results
Understanding the 2026 Research
The 2026 Arizona Voters' Agenda includes three types of findings that together provide a more complete resource for discussion, decision-making, and action.
- Views & Perceptions: additional context about voters' experiences, concerns, and perspectives. They help explain what voters are experiencing, why certain issues matter, and how Arizonans are thinking about Arizona's future.
- Arizona Voters' Agenda – Shared Priorities: issues and approaches that earned broad agreement across political affiliations and generations and met CFA's high standard for inclusion in the Arizona Voters' Agenda.
- Questions for Candidates & Leaders: The research also raises important questions for candidates and leaders. These questions emerge directly from what Arizona voters told us and are intended to help connect voter priorities with leadership, plans, and proposed solutions.
See the survey methodology and how we define consensus to determine the issues that make it onto this action-oriented roadmap.

LEADERSHIP & ARIZONA’S FUTURE New
Arizona voters believe the state has a future worth building and want candidates and leaders to explain how they will help achieve it. The research finds overwhelming interest in hearing candidates directly answer questions about voters’ priorities, a preference for problem-solving, and optimism about Arizona’s future.
These findings reinforce what CFA has heard across years of research. Arizonans want leaders focused on the issues affecting their lives and communities, with clear plans and action that lead to results.
In general, how well do you think the political system is working in Arizona today?
| All Likely Voters | Republican | Democrat | IND/UN | Age 18-29 |
Age 30-39 |
Age 40-49 |
Age 50-64 |
Age 65+ |
|
|---|---|---|---|---|---|---|---|---|---|
| Total Well | 48% | 38% | 58% | 51% | 53% | 51% | 43% | 48% | 48% |
| Total Not Well | 47% | 57% | 37% | 44% | 41% | 46% | 51% | 48% | 48% |
| Don’t Know, Refused | 5% | 4% | 5% | 5% | 7% | 3% | 6% | 5% | 5% |
In general, do you believe Arizona’s best days are ahead?
| All Likely Voters | Republican | Democrat | IND/UN | Age 18-29 |
Age 30-39 |
Age 40-49 |
Age 50-64 |
Age 65+ |
|
|---|---|---|---|---|---|---|---|---|---|
| Total Yes | 60% | 64% | 54% | 59% | 60% | 56% | 57% | 62% | 61% |
| Total No | 28% | 25% | 29% | 30% | 35% | 29% | 31% | 25% | 24% |
| Don’t Know, Refused | 13% | 12% | 16% | 11% | 5% | 15% | 12% | 13% | 15% |
How important is it to you to have opportunities to hear candidates directly answer questions about the issues that matter to the majority of Arizona voters?
| All Likely Voters | Republican | Democrat | IND/UN | Age 18-29 |
Age 30-39 |
Age 40-49 |
Age 50-64 |
Age 65+ |
|
|---|---|---|---|---|---|---|---|---|---|
| Total Important | 93% | 94% | 94% | 91% | 98% | 97% | 92% | 90% | 92% |
| Total Not Important | 6% | 7% | 4% | 6% | 2% | 3% | 6% | 8% | 7% |
| Don’t Know, Refused | 1% | 2% | 2% | 2% | 1% |
I would rather elect leaders who develop practical solutions to Arizona's biggest challenges, even if I don't agree with them on every political issue.
| All Likely Voters | Republican | Democrat | IND/UN | Age 18-29 |
Age 30-39 |
Age 40-49 |
Age 50-64 |
Age 65+ |
|
|---|---|---|---|---|---|---|---|---|---|
| Total Agree | 63% | 59% | 64% | 66% | 55% | 61% | 66% | 55% | 72% |
- What Arizona challenges would be your highest priorities, and what specific actions would you take first?
- Where would you work across political differences to develop practical solutions to Arizona’s biggest challenges?
- What results should Arizonans expect from your leadership, and how should they measure progress?

ELECTIONS New Data
Majorities of Arizona voters across political affiliations are confident the upcoming General Election results will be accurate and concerned about political leaders pressuring election officials to change outcomes. The research also finds continued statewide majority support for voting by mail and existing voter ID laws, although Republican views differ.
CFA's Good Elections Project, released earlier this year, surveyed Arizonans broadly to better understand the values, expectations, and practices people believe every election should reflect. These distinct studies provide context for understanding public confidence and expectations for election administration.
In general, how confident are you that the results of the upcoming General Elections will be accurate? New
| All Likely Voters | Republican | Democrat | IND/UN | Age 18-29 |
Age 30-39 |
Age 40-49 |
Age 50-64 |
Age 65+ |
|
|---|---|---|---|---|---|---|---|---|---|
| Total Confident | 66% | 56% | 77% | 68% | 60% | 77% | 70% | 58% | 67% |
| Total Not Confident | 32% | 42% | 20% | 31% | 40% | 21% | 29% | 39% | 30% |
| Don’t Know, Refused | 2% | 3% | 3% | 1% | 1% | 1% | 3% | 3% |
In general, how concerned are you about political leaders pressuring election officials to change election outcomes? New
| All Likely Voters | Republican | Democrat | IND/UN | Age 18-29 |
Age 30-39 |
Age 40-49 |
Age 50-64 |
Age 65+ |
|
|---|---|---|---|---|---|---|---|---|---|
| Total Confident | 75% | 63% | 88% | 77% | 77% | 71% | 79% | 75% | 74% |
| Total Not Confident | 23% | 33% | 11% | 21% | 20% | 28% | 21% | 22% | 23% |
| Don’t Know, Refused | 3% | 4% | 1% | 2% | 3% | 1% | 4% | 3% |
Which of the following statements comes closer to your view about voting by mail? New
| All Likely Voters | Republican | Democrat | IND/UN | Age 18-29 |
Age 30-39 |
Age 40-49 |
Age 50-64 |
Age 65+ |
|
|---|---|---|---|---|---|---|---|---|---|
| Voting by mail has worked well in the State of Arizona for over 30 years. It is convenient, reliable, and secure. Arizona should continue to allow voting by mail. | 68% | 46% | 94% | 68% | 75% | 83% | 69% | 55% | 68% |
| Voting by mail should be reserved only for people serving in the military and other special circumstances. It is susceptible to manipulation and cannot be trusted. Voting by mail should be eliminated in Arizona. | 29% | 49% | 4% | 29% | 23% | 15% | 27% | 42% | 27% |
In general, how confident are you in the security of elections in Arizona?
| All Likely Voters | Republican | Democrat | IND/UN | Age 18-29 |
Age 30-39 |
Age 40-49 |
Age 50-64 |
Age 65+ |
|
|---|---|---|---|---|---|---|---|---|---|
| Total confident | 65% | 45% | 86% | 69% | 75% | 66% | 59% | 65% | 63% |
| Total not confident | 35% | 54% | 13% | 31% | 20% | 34% | 41% | 35% | 36% |
| Don’t Know, Refused | 1% | 0% | 2% | 5% | 1% |
Which of the following statements comes closer to your view about Arizona elections?
| All Likely Voters | Republican | Democrat | IND/UN | Age 18-29 |
Age 30-39 |
Age 40-49 |
Age 50-64 |
Age 65+ |
|
|---|---|---|---|---|---|---|---|---|---|
| Arizona should make getting election results faster a higher priority, even if it means reducing some voting options such as dropping ballots off at polling places prior to or on Election Day. | 34% | 56% | 14% | 25% | 14% | 29% | 37% | 38% | 39% |
| Arizona should make convenient and accessible voting a higher priority, even if it takes longer to get final election results. | 63% | 38% | 84% | 74% | 85% | 68% | 61% | 59% | 54% |
| Both | 0% | 1% | 2% | ||||||
| Neither | 1% | 3% | 1% | 3% | 3% | ||||
| Other | 1% | 1% | 2% | 1% | |||||
| Don’t Know, Refused | 1% | 1% | 1% | 1% | 2% | 1% | 2% |
When registering to vote, Arizonans must provide documentation proving their identity and citizenship and provide a signature. Voters who vote in person must show photo identification at the polls. Voters who vote by mail must sign their ballot, and election officials verify their identity by comparing the signature on the ballot to the signature on the registration file. Which statement comes closer to your view?
| All Likely Voters | Republican | Democrat | IND/UN | Age 18-29 |
Age 30-39 |
Age 40-49 |
Age 50-64 |
Age 65+ |
|
|---|---|---|---|---|---|---|---|---|---|
| Arizona should require voters to show proof of citizenship beyond a drivers license, such as a birth certificate, before receiving a ballot by mail to help ensure election integrity. | 38% | 63% | 9% | 34% | 32% | 33% | 47% | 37% | 39% |
| Arizona already has strong voter identification laws, and additional requirements for voting by mail could make it harder for eligible voters to participate. | 60% | 32% | 91% | 64% | 66% | 66% | 50% | 62% | 58% |
| Both | 0% | 0% | 1% | 1% | 1% | ||||
| Neither | 2% | 3% | 1% | 2% | 2% | 1% | 2% | ||
| Don’t Know, Refused | 0% | 1% | 1% | 1% |
Do you think there are a significant number of non-citizens voting in Arizona elections?
| All Likely Voters | Republican | Democrat | IND/UN | Age 18-29 |
Age 30-39 |
Age 40-49 |
Age 50-64 |
Age 65+ |
|
|---|---|---|---|---|---|---|---|---|---|
| Total Yes | 41% | 72% | 11% | 31% | 37% | 32% | 49% | 43% | 41% |
| Total No | 54% | 22% | 85% | 64% | 58% | 64% | 47% | 53% | 52% |
| Don't Know | 5% | 5% | 4% | 5% | 5% | 4% | 4% | 4% | 7% |
- What specific safeguard do you believe is missing from Arizona’s current system? What evidence supports your concerns or proposed election changes?
- How would you explain Arizona’s election procedures to voters who lack confidence in them?
- Do you support continuing Arizona’s vote-by-mail system? Why or why not?
- Will you accept the certified results of the 2026 election? What evidence and standards would guide any decision to challenge them?
- How would you measure whether a proposed election change increased security, confidence, or participation?
- Voters across political affiliations express concern about political leaders pressuring election officials to change election outcomes. How would you protect election administration from inappropriate political pressure while ensuring accountability?

EDUCATION New Data
For years, Arizonans have consistently identified education as essential to the state’s future. The 2026 Arizona Voters’ Agenda shows strong support for public education and a comprehensive set of priorities spanning academic foundations, preparation for work and life, education beyond high school, and accountability for public dollars.
That commitment is paired with concern about K–12 performance. Most voters say elected leaders are not doing enough and want greater attention to improving student success and developing Arizona’s homegrown talent pipeline.
How would you rate K-12 public education in the State of Arizona? New
| All Likely Voters | Republican | Democrat | IND/UN | Age 18-29 |
Age 30-39 |
Age 40-49 |
Age 50-64 |
Age 65+ |
|
|---|---|---|---|---|---|---|---|---|---|
| Total Good/Excellent | 10% | 11% | 13% | 7% | 5% | 11% | 14% | 8% | 12% |
| OK | 34% | 35% | 34% | 33% | 37% | 35% | 40% | 35% | 28% |
| Total Poor/Failing | 49% | 47% | 49% | 53% | 55% | 52% | 42% | 50% | 48% |
| Don’t Know, Refused | 1% | 2% | 1% | 1% | 2% | 2% |
I continue to support public education in Arizona. Public schools play an important role in creating opportunity for students, strengthening our economy, and supporting strong communities. New
| All Likely Voters | Republican | Democrat | IND/UN | Age 18-29 |
Age 30-39 |
Age 40-49 |
Age 50-64 |
Age 65+ |
|
|---|---|---|---|---|---|---|---|---|---|
| Total Agree | 83% | 71% | 98% | 84% | 88% | 93% | 87% | 77% | 78% |
| Total Disagree | 15% | 28% | 3% | 12% | 10% | 7% | 13% | 19% | 19% |
| Don’t Know, Refused | 2% | 2% | 4% | 2% | 4% | 3% |
Do you agree or disagree? Arizona's future depends on maintaining a strong public education system that prepares students for success in life and work.
| All Likely Voters | Republican | Democrat | IND/UN | Age 18-29 |
Age 30-39 |
Age 40-49 |
Age 50-64 |
Age 65+ |
|
|---|---|---|---|---|---|---|---|---|---|
| Total Agree | 91% | 86% | 96% | 92% | 97% | 93% | 86% | 93% | 89% |
| Total Disagree | 7% | 9% | 4% | 6% | 2% | 7% | 12% | 5% | 7% |
| Don’t Know, Refused | 2% | 4% | 1% | 2% | 2% | 2% | 4% |
In general, do you believe Arizona’s elected leaders are doing enough to improve K-12 public education for all students? New
| All Likely Voters | Republican | Democrat | IND/UN | Age 18-29 |
Age 30-39 |
Age 40-49 |
Age 50-64 |
Age 65+ |
|
|---|---|---|---|---|---|---|---|---|---|
| Total Yes | 14% | 17% | 12% | 11% | 17% | 15% | 11% | 11% | 16% |
| Total No | 78% | 75% | 79% | 80% | 78% | 75% | 81% | 80% | 75% |
| Don’t Know, Refused | 9% | 9% | 9% | 9% | 5% | 11% | 8% | 9% | 9% |
Our elected leaders are too focused on issues like ESAs/vouchers and not focused enough on improving reading and math outcomes, preparing students for careers, and other priorities that improve student success. New
| All Likely Voters | Republican | Democrat | IND/UN | Age 18-29 |
Age 30-39 |
Age 40-49 |
Age 50-64 |
Age 65+ |
|
|---|---|---|---|---|---|---|---|---|---|
| Total Agree | 77% | 68% | 87% | 77% | 80% | 81% | 73% | 74% | 77% |
| Total Disagree | 17% | 27% | 7% | 14% | 17% | 7% | 20% | 19% | 17% |
| Don’t Know, Refused | 7% | 6% | 6% | 9% | 3% | 12% | 7% | 7% | 6% |
Arizona’s long-term economic success depends on doing more to develop the skills and talents of our own students and workers, not just attracting skilled workers from other states. New
| All Likely Voters | Republican | Democrat | IND/UN | Age 18-29 |
Age 30-39 |
Age 40-49 |
Age 50-64 |
Age 65+ |
|
|---|---|---|---|---|---|---|---|---|---|
| Total Agree | 91% | 90% | 93% | 92% | 88% | 99% | 91% | 88% | 92% |
| Total Disagree | 7% | 9% | 6% | 6% | 8% | 1% | 8% | 11% | 6% |
| Don’t Know, Refused | 1% | 2% | 1% | 1% | 3% | 1% | 1% | 2% |
Do you support or oppose? Increasing access to affordable, high-quality early learning opportunities for 3- and 4-year-olds.
| All Likely Voters | Republican | Democrat | IND/UN | Age 18-29 |
Age 30-39 |
Age 40-49 |
Age 50-64 |
Age 65+ |
|
|---|---|---|---|---|---|---|---|---|---|
| Total Support | 79% | 69% | 90% | 82% | 86% | 92% | 80% | 82% | 67% |
| Total Oppose | 18% | 28% | 6% | 16% | 14% | 7% | 18% | 15% | 29% |
| Don’t Know, Refused | 3% | 3% | 4% | 1% | 1% | 2% | 4% | 4% |
Do you support or oppose? Increasing state investments to help more students afford and attend Arizona's public universities and community colleges.
| All Likely Voters | Republican | Democrat | IND/UN | Age 18-29 |
Age 30-39 |
Age 40-49 |
Age 50-64 |
Age 65+ |
|
|---|---|---|---|---|---|---|---|---|---|
| Total Support | 80% | 61% | 99% | 85% | 92% | 82% | 77% | 78% | 77% |
| Total Oppose | 17% | 33% | 1% | 13% | 8% | 16% | 21% | 19% | 18% |
| Don’t Know, Refused | 3% | 6% | 2% | 3% | 2% | 2% | 6% |
Do you support or oppose? Expanding internships, apprenticeships, and other work-based learning opportunities for students.
| All Likely Voters | Republican | Democrat | IND/UN | Age 18-29 |
Age 30-39 |
Age 40-49 |
Age 50-64 |
Age 65+ |
|
|---|---|---|---|---|---|---|---|---|---|
| Total Support | 95% | 92% | 99% | 96% | 97% | 96% | 92% | 95% | 96% |
| Total Oppose | 3% | 4% | 1% | 3% | 2% | 3% | 6% | 1% | 3% |
| Don’t Know, Refused | 2% | 4% | 1% | 1% | 2% | 1% | 2% | 4% | 1% |
Do you support or oppose? Helping more Arizonans gain job skills and credentials through community colleges and workforce training programs.
| All Likely Voters | Republican | Democrat | IND/UN | Age 18-29 |
Age 30-39 |
Age 40-49 |
Age 50-64 |
Age 65+ |
|
|---|---|---|---|---|---|---|---|---|---|
| Total Support | 96% | 93% | 100% | 97% | 100% | 97% | 90% | 97% | 97% |
| Total Oppose | 3% | 6% | 3% | 3% | 9% | 2% | 3% | ||
| Don’t Know, Refused | 1% | 1% | 1% | 2% |
Do you support or oppose? Ensuring that every student has access to dual enrollment, early college, or other opportunities to earn college credit while in high school.
| All Likely Voters | Republican | Democrat | IND/UN | Age 18-29 |
Age 30-39 |
Age 40-49 |
Age 50-64 |
Age 65+ |
|
|---|---|---|---|---|---|---|---|---|---|
| Total Support | 94% | 92% | 96% | 95% | 93% | 93% | 96% | 95% | 93% |
| Total Oppose | 3% | 5% | 1% | 4% | 5% | 3% | 2% | 3% | 4% |
| Don’t Know, Refused | 2% | 3% | 3% | 1% | 2% | 4% | 2% | 2% | 3% |
Do you agree or disagree? Arizona's future depends on maintaining a strong public education system that prepares students for success in life and work.
| All Likely Voters | Republican | Democrat | IND/UN | Age 18-29 |
Age 30-39 |
Age 40-49 |
Age 50-64 |
Age 65+ |
|
|---|---|---|---|---|---|---|---|---|---|
| Total Agree | 91% | 86% | 96% | 92% | 97% | 93% | 86% | 93% | 89% |
| Total Disagree | 7% | 9% | 4% | 6% | 2% | 7% | 12% | 5% | 7% |
| Don’t Know, Refused | 2% | 4% | 1% | 2% | 2% | 2% | 4% |
Do you agree or disagree? Students should have opportunities to explore careers and learn about future job opportunities before graduating from high school.
| All Likely Voters | Republican | Democrat | IND/UN | Age 18-29 |
Age 30-39 |
Age 40-49 |
Age 50-64 |
Age 65+ |
|
|---|---|---|---|---|---|---|---|---|---|
| Total Agree | 98% | 98% | 97% | 99% | 100% | 99% | 98% | 98% | 97% |
| Total Disagree | 2% | 1% | 2% | 1% | 1% | 2% | 1% | 3% | |
| Don’t Know, Refused | 0% | 0% | 1% | 1% | 1% |
Do you agree or disagree? All schools receiving public funding should publicly report information about student outcomes and performance.
| All Likely Voters | Republican | Democrat | IND/UN | Age 18-29 |
Age 30-39 |
Age 40-49 |
Age 50-64 |
Age 65+ |
|
|---|---|---|---|---|---|---|---|---|---|
| Total Agree | 90% | 93% | 85% | 91% | 90% | 92% | 86% | 90% | 91% |
| Total Disagree | 8% | 5% | 11% | 8% | 10% | 7% | 13% | 6% | 6% |
| Don’t Know, Refused | 2% | 1% | 4% | 1% | 1% | 1% | 4% | 3% |
Do you agree or disagree? Arizona's education system should ensure students develop strong reading, writing, and math skills.
| All Likely Voters | Republican | Democrat | IND/UN | Age 18-29 |
Age 30-39 |
Age 40-49 |
Age 50-64 |
Age 65+ |
|
|---|---|---|---|---|---|---|---|---|---|
| Total Agree | 98% | 98% | 98% | 98% | 100% | 100% | 96% | 98% | 98% |
| Total Disagree | 2% | 1% | 2% | 2% | 4% | 2% | 1% | ||
| Don’t Know, Refused | % | % | % | % | % | % | % | % | % |
Do you agree or disagree? Arizona's K-12 education system should help students develop the skills needed to think critically, solve problems, and adapt in a changing world.
| All Likely Voters | Republican | Democrat | IND/UN | Age 18-29 |
Age 30-39 |
Age 40-49 |
Age 50-64 |
Age 65+ |
|
|---|---|---|---|---|---|---|---|---|---|
| Total Agree | 98% | 97% | 99% | 98% | 100% | 100% | 94% | 98% | 97% |
| Total Disagree | 2% | 2% | 1% | 2% | 6% | 1% | 1% | ||
| Don’t Know, Refused | 1% | 1% | 1% | % | 1% | 1% |
Do you agree or disagree? Arizona needs to increase the number of students who pursue and complete education or training beyond high school.
| All Likely Voters | Republican | Democrat | IND/UN | Age 18-29 |
Age 30-39 |
Age 40-49 |
Age 50-64 |
Age 65+ |
|
|---|---|---|---|---|---|---|---|---|---|
| Total Agree | 87% | 78% | 94% | 91% | 88% | 84% | 89% | 86% | 87% |
| Total Disagree | 11% | 19% | 4% | 7% | 12% | 12% | 10% | 12% | 10% |
| Don’t Know, Refused | 2% | 3% | 1% | 1% | 4% | 1% | 2% | 3% |
- Most voters say elected leaders are not doing enough to improve K-12 public education for all students. What would you do differently, and how would you measure progress?
- Voters agree on many major education priorities. Where do you see the best opportunity to work across party lines and make progress?
- What would you do to expand access to affordable, high-quality early learning for Arizona families?
- What is your plan to improve reading, writing, math, and other student outcomes. How would you measure progress?
- How would you ensure transparency and accountability for all schools receiving public funding, including schools receiving ESA or voucher funding?
- How would you expand access and help more students enroll in and complete education or training beyond high school?
- Voters say elected leaders are too focused on ESAs and vouchers and not focused enough on other priorities that improve student success. How would you respond to that concern in setting your education agenda?

ECONOMIC OPPORTUNITY & WORKFORCE New
Arizona voters believe long-term economic success depends on doing more to develop the skills and talents of the state’s own students and workers, alongside attracting talent from elsewhere. They strongly support education and career pathways, while identifying wages, housing costs, and other barriers that make it difficult to get ahead.
The findings reflect a broader economic agenda. Developing Arizona’s talent requires both pathways into good careers and conditions that allow people to pursue those opportunities, including access to affordable childcare and the ability to build a life here.
Arizona’s long-term economic success depends on doing more to develop the skills and talents of our own students and workers, not just attracting skilled workers from other states. New
| All Likely Voters | Republican | Democrat | IND/UN | Age 18-29 |
Age 30-39 |
Age 40-49 |
Age 50-64 |
Age 65+ |
|
|---|---|---|---|---|---|---|---|---|---|
| Total Agree | 91% | 90% | 93% | 92% | 88% | 99% | 91% | 88% | 92% |
| Total Disagree | 7% | 9% | 6% | 6% | 8% | 1% | 8% | 11% | 6% |
| Don’t Know, Refused | 1% | 2% | 1% | 1% | 3% | 1% | 1% | 2% |
Childcare is important to both families and Arizona's workforce. Our state and our economy would benefit significantly from expanding access to affordable childcare. New
| All Likely Voters | Republican | Democrat | IND/UN | Age 18-29 |
Age 30-39 |
Age 40-49 |
Age 50-64 |
Age 65+ |
|
|---|---|---|---|---|---|---|---|---|---|
| Total Agree | 80% | 62% | 98% | 86% | 93% | 95% | 80% | 73% | 74% |
| Total Disagree | 15% | 30% | 1% | 10% | 5% | 5% | 12% | 21% | 21% |
| Don’t Know, Refused | 5% | 8% | 1% | 4% | 2% | 8% | 6% | 5% |
- Voters say Arizona’s long-term economic success depends on doing more to develop the skills and talents of our own students and workers. How would you help more Arizonans prepare for good jobs and advance in their careers?
- Voters identify wages not keeping pace with living costs and high housing costs as leading barriers to improving their financial circumstances. What would you do to help more Arizonans get ahead?
- Voters see affordable childcare as important to families, workforce participation, and Arizona’s economy. What role would expanding access to affordable childcare play in your workforce and economic strategy?

AFFORDABILITY & HOUSING New Data
Affordability affects Arizonans’ daily lives and their ability to build a future here. Housing is a leading source of financial strain, and most voters say improving their financial circumstances is difficult. Wages not keeping pace with living costs and high housing costs stand out as the leading barriers to getting ahead. The research also explores how voters want leaders to respond.
In your opinion, how easy is it to improve your financial circumstances in Arizona? New
| All Likely Voters | Republican | Democrat | IND/UN | Age 18-29 |
Age 30-39 |
Age 40-49 |
Age 50-64 |
Age 65+ |
|
|---|---|---|---|---|---|---|---|---|---|
| Total Easy | 35% | 48% | 22% | 31% | 22% | 23% | 33% | 41% | 41% |
| Total Difficult | 58% | 44% | 72% | 63% | 73% | 77% | 61% | 55% | 43% |
| Don’t Know, Refused | 7% | 9% | 6% | 6% | 5% | 6% | 5% | 15% |
What do you think are the biggest barriers preventing more Arizonans from improving their financial circumstances? New
| All Likely Voters | Republican | Democrat | IND/UN | Age 18-29 |
Age 30-39 |
Age 40-49 |
Age 50-64 |
Age 65+ |
|
|---|---|---|---|---|---|---|---|---|---|
| Wages not keeping up with cost of living | 57% | 45% | 68% | 62% | 67% | 59% | 63% | 50% | 54% |
| High housing costs | 54% | 52% | 54% | 56% | 62% | 61% | 63% | 52% | 43% |
| Lack of affordable child care | 14% | 14% | 18% | 11% | 10% | 19% | 17% | 12% | 14% |
| No available good-paying jobs | 10% | 8% | 12% | 9% | 13% | 12% | 9% | 11% | 6% |
| Lack of job training opportunities | 8% | 10% | 8% | 8% | 8% | 5% | 6% | 13% | 8% |
| Transportation challenges | 7% | 9% | 8% | 5% | 12% | 7% | 8% | 5% | 7% |
| Family responsibilities | 7% | 9% | 4% | 8% | 8% | 7% | 10% | 6% | 6% |
| Don’t Know, Refused | 4% | 7% | 3% | 2% | 3% | 3% | 10% |
Compared to 2 years ago, would you say cost of living has gotten better, worse or stayed about the same?
| All Likely Voters | Republican | Democrat | IND/UN | Age 18-29 |
Age 30-39 |
Age 40-49 |
Age 50-64 |
Age 65+ |
|
|---|---|---|---|---|---|---|---|---|---|
| Total Better | 6% | 12% | 1% | 3% | 3% | 4% | 9% | 9% | |
| About the same | 12% | 19% | 6% | 7% | 7% | 9% | 11% | 12% | 14% |
| Total Worse | 82% | 68% | 93% | 89% | 90% | 91% | 83% | 78% | 76% |
| Don’t Know, Refused | 8% | 7% | 8% | 8% | 17% | 5% | 7% | 3% | 10% |
Compared to 2 years ago, would you say Arizona's economy has gotten better, worse or stayed about the same?
| All Likely Voters | Republican | Democrat | IND/UN | Age 18-29 |
Age 30-39 |
Age 40-49 |
Age 50-64 |
Age 65+ |
|
|---|---|---|---|---|---|---|---|---|---|
| Total Better | 15% | 22% | 8% | 14% | 12% | 13% | 16% | 17% | 17% |
| About the same | 28% | 33% | 21% | 29% | 19% | 29% | 19% | 32% | 34% |
| Total Worse | 49% | 37% | 63% | 50% | 53% | 53% | 59% | 48% | 40% |
| Don’t Know, Refused | 8% | 7% | 8% | 8% | 17% | 5% | 7% | 3% | 10% |
Compared to 2 years ago, would you say the State of Arizona's budget has gotten better, worse or stayed about the same?
| All Likely Voters | Republican | Democrat | IND/UN | Age 18-29 |
Age 30-39 |
Age 40-49 |
Age 50-64 |
Age 65+ |
|
|---|---|---|---|---|---|---|---|---|---|
| Total Better | 8% | 6% | 9% | 8% | 7% | 4% | 8% | 13% | 5% |
| About the same | 22% | 20% | 23% | 24% | 22% | 26% | 12% | 18% | 30% |
| Total Worse | 38% | 42% | 37% | 34% | 44% | 38% | 44% | 38% | 35% |
| Don’t Know, Refused | 32% | 31% | 31% | 35% | 27% | 37% | 36% | 32% | 30% |
Compared to 2 years ago, would you say inflation has gotten better, worse or stayed about the same?
| All Likely Voters | Republican | Democrat | IND/UN | Age 18-29 |
Age 30-39 |
Age 40-49 |
Age 50-64 |
Age 65+ |
|
|---|---|---|---|---|---|---|---|---|---|
| Total Better | 9% | 16% | 3% | 7% | 5% | 1% | 11% | 12% | 12% |
| About the same | 13% | 20% | 3% | 14% | 2% | 7% | 16% | 17% | 16% |
| Total Worse | 77% | 63% | 94% | 76% | 92% | 91% | 73% | 70% | 71% |
| Don’t Know, Refused | 1% | 1% | 2% | 2% | 1% | 2% | 1% |
Compared to 2 years ago, would you say gas prices have gotten better, worse or stayed about the same?
| All Likely Voters | Republican | Democrat | IND/UN | Age 18-29 |
Age 30-39 |
Age 40-49 |
Age 50-64 |
Age 65+ |
|
|---|---|---|---|---|---|---|---|---|---|
| Total Better | 8% | 16% | 2% | 4% | 2% | 1% | 6% | 11% | 14% |
| About the same | 11% | 18% | 1% | 11% | 5% | 7% | 13% | 15% | 10% |
| Total Worse | 79% | 62% | 97% | 81% | 92% | 89% | 79% | 72% | 73% |
| Don’t Know, Refused | 2% | 3% | 3% | 2% | 3% | 2% | 2% | 3% |
How difficult do you think it is for most people in Arizona to cover their basic monthly expenses, such as housing, groceries, gas, utilities, and healthcare?
| All Likely Voters | Republican | Democrat | IND/UN | Age 18-29 |
Age 30-39 |
Age 40-49 |
Age 50-64 |
Age 65+ |
|
|---|---|---|---|---|---|---|---|---|---|
| Total Not Difficult | 7% | 13% | 2% | 3% | 5% | 5% | 4% | 8% | 8% |
| Total Difficult | 90% | 83% | 96% | 94% | 95% | 95% | 94% | 88% | 85% |
| Don’t Know, Refused | 3% | 4% | 2% | 4% | 1% | 4% | 7% |
For you personally, how difficult is it to cover your basic monthly expenses, such as housing, groceries, gas, utilities, and healthcare?
| All Likely Voters | Republican | Democrat | IND/UN | Age 18-29 |
Age 30-39 |
Age 40-49 |
Age 50-64 |
Age 65+ |
|
|---|---|---|---|---|---|---|---|---|---|
| Total Not Difficult | 52% | 59% | 43% | 52% | 36% | 42% | 50% | 55% | 62% |
| Total Difficult | 48% | 41% | 57% | 48% | 64% | 58% | 49% | 45% | 38% |
| Don’t Know, Refused | 0% | 0% | 1% |
Which of the following costs do you think are contributing most to financial strain for people in Arizona right now?
| All Likely Voters | Republican | Democrat | IND/UN | Age 18-29 |
Age 30-39 |
Age 40-49 |
Age 50-64 |
Age 65+ |
|
|---|---|---|---|---|---|---|---|---|---|
| Housing | 52% | 51% | 52% | 54% | 56% | 50% | 52% | 52% | 51% |
| Groceries | 28% | 28% | 28% | 29% | 17% | 28% | 26% | 28% | 34% |
| Gas/Transportation | 22% | 24% | 21% | 19% | 17% | 14% | 21% | 22% | 28% |
| Utilities | 10% | 14% | 4% | 10% | 5% | 5% | 10% | 13% | 12% |
| Childcare | 8% | 7% | 11% | 6% | 8% | 20% | 3% | 8% | 6% |
| Healthcare | 16% | 19% | 16% | 11% | 15% | 11% | 16% | 22% | 14% |
| Wages not keeping up with inflation | 44% | 35% | 50% | 49% | 63% | 59% | 54% | 35% | 30% |
| Other | 2% | 1% | 3% | 1% | 4% | 4% | 4% | 3% | 1% |
| Don’t Know, Refused | 1% | 1% | 1% | 1% | 2% |
I would support more housing options such as duplexes, townhomes, casitas, and homes on smaller lots being built in my community if it helped address housing affordability in Arizona.
| All Likely Voters | Republican | Democrat | IND/UN | Age 18-29 |
Age 30-39 |
Age 40-49 |
Age 50-64 |
Age 65+ |
|
|---|---|---|---|---|---|---|---|---|---|
| Total Agree | 66% | 50% | 86% | 66% | 85% | 68% | 64% | 65% | 59% |
| Total Disagree | 31% | 48% | 11% | 30% | 15% | 28% | 30% | 33% | 39% |
| Don’t Know, Refused | 3% | 2% | 3% | 4% | 4% | 6% | 2% | 3% |
Rising housing and other living costs in Arizona have made me more likely to consider moving to another state.
| All Likely Voters | Republican | Democrat | IND/UN | Age 18-29 |
Age 30-39 |
Age 40-49 |
Age 50-64 |
Age 65+ |
|
|---|---|---|---|---|---|---|---|---|---|
| Total Agree | 43% | 34% | 48% | 49% | 69% | 49% | 52% | 38% | 28% |
| Total Disagree | 55% | 65% | 49% | 49% | 31% | 50% | 46% | 59% | 70% |
| Don’t Know, Refused | 2% | 1% | 3% | 2% | 1% | 2% | 3% | 2% |
Which of the following statements comes closer to your view on housing?
| All Likely Voters | Republican | Democrat | IND/UN | Age 18-29 |
Age 30-39 |
Age 40-49 |
Age 50-64 |
Age 65+ |
|
|---|---|---|---|---|---|---|---|---|---|
| Arizona should make it easier to build more housing, even if local communities have less control over development decisions. | 24% | 19% | 29% | 25% | 39% | 32% | 22% | 20% | 18% |
| Other | 0% | 0% | 1% | ||||||
| Local communities should maintain control over housing development decisions, even if it limits how much housing gets built. | 68% | 72% | 62% | 69% | 53% | 58% | 72% | 73% | 72% |
| Both | 1% | 1% | 1% | 1% | |||||
| Don’t Know, Refused | 5% | 6% | 5% | 3% | 8% | 5% | 3% | 5% | 5% |
| Neither | 2% | 1% | 4% | 3% | 4% | 2% | 2% | 3% |
- What would you do to make Arizona more affordable for people who live and work here?
- Voters support more housing options but also want local communities to retain control over development decisions. How would you address both priorities?
- Arizona voters have consistently identified housing affordability as an important priority. Where do you see the greatest opportunity to make meaningful progress?
- Rising living costs are causing a significant number of voters, especially younger Arizonans, to consider leaving the state. What would you do to help Arizona retain workers and families?

HEALTHCARE New
Arizona voters share priorities for healthcare that is affordable, accessible, and able to meet needs across the state. Broad agreement extends to increasing the healthcare workforce, expanding care in rural and underserved communities, and improving access to mental and behavioral healthcare.
The research also examines experiences with delayed care, confidence in affording healthcare, and views on childhood vaccination policy. Together, the findings provide insight into voters’ healthcare priorities they want leaders to address.
During periods of extreme heat in Arizona, how much does the heat affect your or your household’s health, daily activities, or ability to work? New
| All Likely Voters | Republican | Democrat | IND/UN | Age 18-29 |
Age 30-39 |
Age 40-49 |
Age 50-64 |
Age 65+ |
|
|---|---|---|---|---|---|---|---|---|---|
| Total Impacted | 77% | 70% | 84% | 80% | 83% | 85% | 80% | 73% | 73% |
| Total Not Impacted | 22% | 29% | 15% | 19% | 17% | 13% | 19% | 25% | 27% |
| Don’t Know, Refused | 1% | 1% | 1% | 1% | 1% | 1% | 2% |
In the past 12 months, how often did you delay getting health care for one or more of the following reasons? New
| All Likely Voters | Republican | Democrat | IND/UN | Age 18-29 |
Age 30-39 |
Age 40-49 |
Age 50-64 |
Age 65+ |
|
|---|---|---|---|---|---|---|---|---|---|
| Cost | 34% | 24% | 41% | 39% | 53% | 56% | 38% | 32% | 13% |
| Difficulty getting an appointment | 26% | 23% | 29% | 28% | 35% | 27% | 39% | 23% | 17% |
| Transportation | 8% | 9% | 7% | 9% | 8% | 9% | 10% | 6% | 8% |
| Something else | 11% | 8% | 13% | 14% | 18% | 12% | 12% | 10% | 8% |
| Don’t Know, Refused | 41% | 52% | 36% | 32% | 20% | 23% | 36% | 44% | 61% |
How confident are you about being able to afford healthcare for yourself and your family over the next year? New
| All Likely Voters | Republican | Democrat | IND/UN | Age 18-29 |
Age 30-39 |
Age 40-49 |
Age 50-64 |
Age 65+ |
|
|---|---|---|---|---|---|---|---|---|---|
| Total Confident | 70% | 77% | 68% | 61% | 53% | 67% | 68% | 69% | 79% |
| Total Not Confident | 28% | 20% | 30% | 36% | 45% | 33% | 30% | 27% | 17% |
| Don’t Know, Refused | 3% | 4% | 3% | 2% | 3% | 3% | 4% | 4% |
Which of the following statements comes closer to your view about vaccines? New
| All Likely Voters | Republican | Democrat | IND/UN | Age 18-29 |
Age 30-39 |
Age 40-49 |
Age 50-64 |
Age 65+ |
|
|---|---|---|---|---|---|---|---|---|---|
| Arizona should continue to follow guidance from pediatric and public health experts on childhood vaccines, including maintaining existing vaccination requirements to protect children and communities. | 59% | 34% | 86% | 65% | 73% | 72% | 64% | 50% | 52% |
| Parents should have greater freedom to decide which vaccines their children receive. Arizona should reduce childhood vaccination requirements and give parents more ability to make these medical decisions for their children. | 36% | 60% | 11% | 29% | 20% | 23% | 30% | 46% | 43% |
| Don’t Know, Refused | 1% | 1% | 1% | 1% | 2% | 1% |
Increasing the number of healthcare workers. New
| All Likely Voters | Republican | Democrat | IND/UN | Age 18-29 |
Age 30-39 |
Age 40-49 |
Age 50-64 |
Age 65+ |
|
|---|---|---|---|---|---|---|---|---|---|
| Total Support | 89% | 85% | 96% | 86% | 92% | 93% | 88% | 88% | 87% |
| Total Oppose | 7% | 11% | 4% | 5% | 7% | 3% | 6% | 8% | 9% |
| Don’t Know, Refused | 4% | 5% | 9% | 2% | 4% | 7% | 5% | 4% |
Improving access to affordable healthcare. New
| All Likely Voters | Republican | Democrat | IND/UN | Age 18-29 |
Age 30-39 |
Age 40-49 |
Age 50-64 |
Age 65+ |
|
|---|---|---|---|---|---|---|---|---|---|
| Total Support | 90% | 82% | 98% | 92% | 95% | 93% | 89% | 87% | 89% |
| Total Oppose | 8% | 14% | 2% | 6% | 5% | 5% | 8% | 10% | 8% |
| Don’t Know, Refused | 2% | 5% | 1% | 1% | 3% | 3% | 3% |
Expanding access to healthcare in rural and underserved communities. New
| All Likely Voters | Republican | Democrat | IND/UN | Age 18-29 |
Age 30-39 |
Age 40-49 |
Age 50-64 |
Age 65+ |
|
|---|---|---|---|---|---|---|---|---|---|
| Total Support | 88% | 78% | 99% | 90% | 93% | 92% | 89% | 83% | 88% |
| Total Oppose | 8% | 16% | 1% | 4% | 5% | 5% | 7% | 11% | 8% |
| Don’t Know, Refused | 4% | 6% | 1% | 6% | 2% | 3% | 4% | 6% | 4% |
Improving access to mental and behavioral healthcare. New
| All Likely Voters | Republican | Democrat | IND/UN | Age 18-29 |
Age 30-39 |
Age 40-49 |
Age 50-64 |
Age 65+ |
|
|---|---|---|---|---|---|---|---|---|---|
| Total Support | 93% | 87% | 99% | 95% | 98% | 97% | 91% | 92% | 91% |
| Total Oppose | 5% | 10% | 1% | 2% | 2% | 3% | 3% | 5% | 8% |
| Don’t Know, Refused | 2% | 4% | 3% | 6% | 4% | 1% |
- What would you do to improve access to affordable healthcare for Arizonans?
- How would you increase the number of healthcare workers to help meet Arizona’s needs?
- What actions would you take to expand access to healthcare in rural and underserved communities?
- How would you improve access to mental and behavioral healthcare?

WATER New Data
Arizona voters identify long-term water supplies as one of the state’s most pressing challenges. Most question whether Arizona will have enough water to support residents, agriculture, and economic growth over the long term, and whether leaders are taking the necessary steps to secure that future.
Those concerns are paired with strong support for long-term investment, expanding water supplies, and strengthening rural groundwater protections. The findings show voters want action to prepare Arizona for continued growth and protect its prosperity and quality of life.
How confident are you that Arizona leaders are taking the necessary steps to secure Arizona’s water future? New
| All Likely Voters | Republican | Democrat | IND/UN | Age 18-29 |
Age 30-39 |
Age 40-49 |
Age 50-64 |
Age 65+ |
|
|---|---|---|---|---|---|---|---|---|---|
| Total Confident | 34% | 29% | 37% | 38% | 22% | 33% | 30% | 34% | 42% |
| Total Not Confident | 64% | 68% | 61% | 61% | 75% | 67% | 67% | 65% | 56% |
| Don’t Know, Refused | 2% | 3% | 2% | 1% | 3% | 3% | 2% | 2% |
How confident are you that Arizona’s water systems can reliably support the state’s future growth and extreme heat conditions?
| All Likely Voters | Republican | Democrat | IND/UN | Age 18-29 |
Age 30-39 |
Age 40-49 |
Age 50-64 |
Age 65+ |
|
|---|---|---|---|---|---|---|---|---|---|
| Total Confident | 28% | 33% | 23% | 27% | 32% | 30% | 22% | 29% | 28% |
| Total Not Confident | 71% | 65% | 76% | 73% | 68% | 70% | 76% | 71% | 70% |
| Don’t Know, Refused | 1% | 1% | 1% | 2% | 2% |
Do you believe Arizona will have enough water to support residents, agriculture, and future economic growth over the long term?
| All Likely Voters | Republican | Democrat | IND/UN | Age 18-29 |
Age 30-39 |
Age 40-49 |
Age 50-64 |
Age 65+ |
|
|---|---|---|---|---|---|---|---|---|---|
| Total Yes | 27% | 34% | 20% | 25% | 31% | 24% | 22% | 30% | 28% |
| Total No | 69% | 60% | 77% | 72% | 68% | 71% | 74% | 68% | 66% |
| Don’t Know | 4% | 5% | 3% | 3% | 2% | 5% | 3% | 2% | 6% |
Our elected leaders must make long-term investments to secure our water future, including dedicating more state funding to water. New
| All Likely Voters | Republican | Democrat | IND/UN | Age 18-29 |
Age 30-39 |
Age 40-49 |
Age 50-64 |
Age 65+ |
|
|---|---|---|---|---|---|---|---|---|---|
| Total Agree | 93% | 90% | 97% | 91% | 95% | 93% | 94% | 95% | 88% |
| Total Disagree | 5% | 8% | 1% | 5% | 3% | 4% | 4% | 2% | 9% |
| Don’t Know, Refused | 2% | 2% | 2% | 4% | 2% | 3% | 1% | 3% | 3% |
Arizona needs to add to the state's water supply through strategies like finding other water sources, investing in desalination, and recycling wastewater. New
| All Likely Voters | Republican | Democrat | IND/UN | Age 18-29 |
Age 30-39 |
Age 40-49 |
Age 50-64 |
Age 65+ |
|
|---|---|---|---|---|---|---|---|---|---|
| Total Agree | 89% | 87% | 96% | 86% | 93% | 97% | 84% | 86% | 90% |
| Total Disagree | 8% | 9% | 3% | 12% | 7% | 3% | 12% | 10% | 6% |
| Don’t Know, Refused | 3% | 5% | 1% | 2% | 3% | 4% | 4% |
Do you believe Arizona should strengthen groundwater protections in rural parts of the state that currently have fewer groundwater regulations?
| All Likely Voters | Republican | Democrat | IND/UN | Age 18-29 |
Age 30-39 |
Age 40-49 |
Age 50-64 |
Age 65+ |
|
|---|---|---|---|---|---|---|---|---|---|
| Total Yes | 78% | 68% | 87% | 81% | 88% | 72% | 77% | 78% | 77% |
| Total No | 12% | 19% | 6% | 7% | 8% | 16% | 13% | 12% | 10% |
| Don’t Know | 10% | 11% | 6% | 11% | 3% | 12% | 10% | 10% | 11% |
| Refused | 1% | 1% | 1% | 2% |
Which comes closer to your view?
| All Likely Voters | Republican | Democrat | IND/UN | Age 18-29 |
Age 30-39 |
Age 40-49 |
Age 50-64 |
Age 65+ |
|
|---|---|---|---|---|---|---|---|---|---|
| Arizona needs to build more housing to keep up with growth and affordability needs, even if communities cannot guarantee a long-term water supply. | 16% | 21% | 11% | 14% | 19% | 16% | 23% | 15% | 12% |
| Arizona should limit new housing development in areas where there isn’t a guaranteed long-term water supply. | 78% | 72% | 83% | 83% | 78% | 83% | 72% | 77% | 81% |
| Both | 0% | 0% | 1% | 2% | 1% | ||||
| Neither | 2% | 1% | 2% | 1% | 1% | 3% | 2% | ||
| Don’t Know, Refused | 3% | 4% | 3% | 1% | 2% | 1% | 1% | 5% | 3% |
- Long-term water supplies are voters’ top concern. What specific actions would you take to strengthen Arizona’s water security?
- Voters support stronger rural groundwater protections and limiting development where long-term water supplies are not assured. How would those priorities guide your approach to growth?
- Most voters are not confident Arizona’s water systems can support future growth and extreme heat. What would you do to strengthen both water resilience and public confidence?
- Voters support long-term water investments, including additional state funding and strategies to expand Arizona’s water supply. What investments would you prioritize, and how would you fund them?

GROWTH & INFRASTRUCTURE New
In addition to water, Arizona voters want key systems supporting the state’s communities and economy to keep pace with growth. The research finds broad agreement on the importance of reliable, affordable energy, alongside concern about whether energy systems can meet the demands of future growth and extreme heat.
Voters also support investments to prepare communities and infrastructure for increasingly extreme heat and believe growing industries should pay a fair share of the infrastructure costs their growth creates. These findings broaden the discussion of water to questions about how Arizona plans, invests, and prepares for its future.
Arizona’s long-term economic success depends on doing more to develop the skills and talents of our own students and workers, not just attracting skilled workers from other states. New
| All Likely Voters | Republican | Democrat | IND/UN | Age 18-29 |
Age 30-39 |
Age 40-49 |
Age 50-64 |
Age 65+ |
|
|---|---|---|---|---|---|---|---|---|---|
| Total Agree | 91% | 90% | 93% | 92% | 88% | 99% | 91% | 88% | 92% |
| Total Disagree | 7% | 9% | 6% | 6% | 8% | 1% | 8% | 11% | 6% |
| Don’t Know, Refused | 1% | 2% | 1% | 1% | 3% | 1% | 1% | 2% |
Which of the following statements comes closer to your view about infrastructure needs? New
| All Likely Voters | Republican | Democrat | IND/UN | Age 18-29 |
Age 30-39 |
Age 40-49 |
Age 50-64 |
Age 65+ |
|
|---|---|---|---|---|---|---|---|---|---|
| Arizona’s growing manufacturing, technology, and other new industries are increasing our infrastructure needs. They should pay their fair share of those costs, rather than putting the burden on existing ratepayers. | 65% | 60% | 72% | 66% | 63% | 68% | 71% | 68% | 59% |
| Arizona should encourage new industries to invest and create jobs here, not penalize them with added costs. Infrastructure benefits everyone, so its costs should be shared broadly. | 25% | 30% | 19% | 26% | 30% | 24% | 21% | 21% | 31% |
| Don’t Know, Refused | 4% | 5% | 6% | 3% | 2% | 7% | 3% | 5% | 4% |
In general, how confident are you that Arizona is prepared to meet future energy demand? New
| All Likely Voters | Republican | Democrat | IND/UN | Age 18-29 |
Age 30-39 |
Age 40-49 |
Age 50-64 |
Age 65+ |
|
|---|---|---|---|---|---|---|---|---|---|
| Total Confident | 46% | 47% | 53% | 38% | 55% | 36% | 41% | 42% | 54% |
| Total Not Confident | 52% | 52% | 46% | 59% | 45% | 63% | 56% | 56% | 43% |
| Don’t Know, Refused | 2% | 2% | 2% | 3% | 1% | 3% | 2% | 3% |
During periods of extreme heat in Arizona, how much does the heat affect your or your household’s health, daily activities, or ability to work? New
| All Likely Voters | Republican | Democrat | IND/UN | Age 18-29 |
Age 30-39 |
Age 40-49 |
Age 50-64 |
Age 65+ |
|
|---|---|---|---|---|---|---|---|---|---|
| Total Impacted | 77% | 70% | 84% | 80% | 83% | 85% | 80% | 73% | 73% |
| Total Not Impacted | 22% | 29% | 15% | 19% | 17% | 13% | 19% | 25% | 27% |
| Don’t Know, Refused | 1% | 1% | 1% | 1% | 1% | 1% | 2% |
Reliable and affordable energy is essential to Arizona's future quality of life and economic prosperity.
| All Likely Voters | Republican | Democrat | IND/UN | Age 18-29 |
Age 30-39 |
Age 40-49 |
Age 50-64 |
Age 65+ |
|
|---|---|---|---|---|---|---|---|---|---|
| Total Agree | 97% | 96% | 99% | 97% | 98% | 100% | 94% | 96% | 98% |
| Total Disagree | 2% | 3% | 1% | 3% | 2% | 3% | 3% | 2% | |
| Don’t Know, Refused | 1% | 2% | 2% | 1% |
Arizona must make investments to prepare communities and infrastructure for increasingly extreme heat.
| All Likely Voters | Republican | Democrat | IND/UN | Age 18-29 |
Age 30-39 |
Age 40-49 |
Age 50-64 |
Age 65+ |
|
|---|---|---|---|---|---|---|---|---|---|
| Total Agree | 90% | 85% | 97% | 90% | 95% | 91% | 87% | 90% | 90% |
| Total Disagree | 8% | 12% | 3% | 9% | 5% | 9% | 10% | 9% | 8% |
| Don’t Know, Refused | 2% | 4% | 1% | 3% | 1% | 3% |
- What Arizona challenges would be your highest priorities, and what specific actions would you take first?
- Where would you work across political differences to develop practical solutions to Arizona’s biggest challenges?
- What results should Arizonans expect from your Infrastructure, and how should they measure progress?
- What is your plan to ensure water, energy, and infrastructure keep pace with Arizona’s growth, and what investments should the state make now to prepare for future demand?
- Voters consider reliable, affordable energy essential to Arizona’s future, but many question whether energy systems can support future growth and extreme heat. What would you do to address those concerns?
- Voters say growing industries should pay a fair share of the infrastructure costs their growth creates. How would you approach sharing those costs among industries, existing ratepayers, and the public?
- • How would you prepare Arizona’s communities and infrastructure for increasingly extreme heat and its effects on health, daily activities, and the ability to work?

IMMIGRATION
Arizona voters continue to express a pragmatic approach to immigration that reflects the realities of a border state. There are areas of broad agreement around border security, legal immigration, economic opportunity, and effective systems.
The United States should create a clearer and easier legal pathway to citizenship for immigrants who meet established requirements.
| All Likely Voters | Republican | Democrat | IND/UN | Age 18-29 |
Age 30-39 |
Age 40-49 |
Age 50-64 |
Age 65+ |
|
|---|---|---|---|---|---|---|---|---|---|
| Total Agree | 86% | 75% | 97% | 91% | 95% | 91% | 82% | 88% | 81% |
| Total Disagree | 13% | 23% | 3% | 9% | 5% | 8% | 17% | 11% | 17% |
| Don’t Know, Refused | 1% | 2% | 1% | 1% | 1% | 2% | 1% |
Mexico is Arizona’s largest trade and tourism partner. Arizona should prioritize both border security and a functioning border for commerce, trade, and legal immigration.
| All Likely Voters | Republican | Democrat | IND/UN | Age 18-29 |
Age 30-39 |
Age 40-49 |
Age 50-64 |
Age 65+ |
|
|---|---|---|---|---|---|---|---|---|---|
| Total Agree | 90% | 91% | 89% | 90% | 97% | 78% | 92% | 92% | 91% |
| Total Disagree | 8% | 7% | 9% | 6% | 2% | 18% | 6% | 6% | 7% |
| Don’t Know, Refused | 2% | 2% | 1% | 4% | 2% | 4% | 2% | 2% | 2% |
Which comes closer to your view?
| All Likely Voters | Republican | Democrat | IND/UN | Age 18-29 |
Age 30-39 |
Age 40-49 |
Age 50-64 |
Age 65+ |
|
|---|---|---|---|---|---|---|---|---|---|
| Arizona and the United States should enforce immigration laws while while making sure to treat immigrants who are legally in the country fairly and respectfully. | 74% | 57% | 89% | 83% | 76% | 82% | 74% | 72% | 71% |
| Arizona and the United States should prioritize stricter immigration enforcement, even if some legal immigrants experience additional scrutiny or restrictions. | 21% | 36% | 8% | 16% | 22% | 14% | 23% | 22% | 23% |
| Both | 2% | 3% | 1% | 1% | 3% | 2% | 3% | ||
| Neither | 1% | 1% | 1% | 1% | 2% | 1% | |||
| Other | 1% | 1% | |||||||
| Don’t Know, Refused | 1% | 2% | 1% | 1% | 2% | 1% | 1% | 2% | 1% |
- Arizona voters support both border security and a functioning border for commerce, trade, and legal immigration. What would you do to advance all of those priorities?
- Voters support a clearer legal pathway to citizenship for immigrants who meet established requirements. What role would you play in advancing that priority?
- Immigration policy involves federal, state, and local authority. What actions are within the power of the office you are seeking, and where would you work with other levels of government?
- Immigration has been a long-standing priority with little progress over the decades, despite broad public support for reform. What specific steps will you take to build bipartisan coalitions and advocate for comprehensive immigration solutions?
Understanding the 2026 Arizona Voters' Agenda
What Qualifies as an Arizona Voters' Agenda Priority?
The Arizona Voters’ Agenda surveys ask about a wide array of issues and topics, and some items do not reach the level of agreement among likely voters required to be included.
The resulting Arizona Voters’ Agenda is built on where there is broad consensus focusing on issues agreed upon by the electorate. By setting a high bar for inclusion—demanding over 50% strong agreement among all voters and agreement across every political affiliation and age group—it ensures the agenda reflects widely supported policies.
This method filters out partisan issues, highlighting priorities with real potential for progress and representing concerns crucial to the vast majority of Arizona's likely voters. This process not only fosters a nonpartisan approach but also aims to provide practical and actionable policy insights for the state.
How We Define Agreement
The Arizona Voters' Agenda intentionally sets a high standard for agreement.

To qualify as an official Arizona Voters' Agenda priority, an action item must rec eive:
- Strong support from at least 50% of all likely Arizona voters
- Majority support across Republicans, Democrats, Independents/Unaffiliated voters, and every age group surveyed
This rigorous standard helps identify priorities that reach broadly across Arizona's electorate and represent meaningful opportunities for progress.
About the Surveys & Methodology
The 2026 Arizona Voters’ Agenda draws from two statewide surveys conducted June 15-18 and Aug. 24-28, 2026. Each surveyed 500 likely Arizona General Election voters and was balanced to reflect expected turnout across party, age, region, and gender. Live interviews were conducted in English and Spanish by HighGround, Inc., among landline and mobile phone users. The partisan advantage was set at +8% Republican based on previous election trends. Each survey has a margin of error of ±4.3%.
The surveys examine a wide range of issues, approaches, public concerns, experiences, and priorities among likely Arizona voters. Questions are neutrally framed, and the research tests different approaches and levels of support to provide an accurate understanding of voters’ views across the state, party affiliations, and age groups.
To be included in the Arizona Voters' Agenda, each priority must receive support from at least 50% of all likely voters, as well as at least 50% of Republicans, Democrats, independents/unaffiliated voters, and every age group. The survey also includes broader questions that provide context about Arizona voters' experiences, concerns, and perspectives.
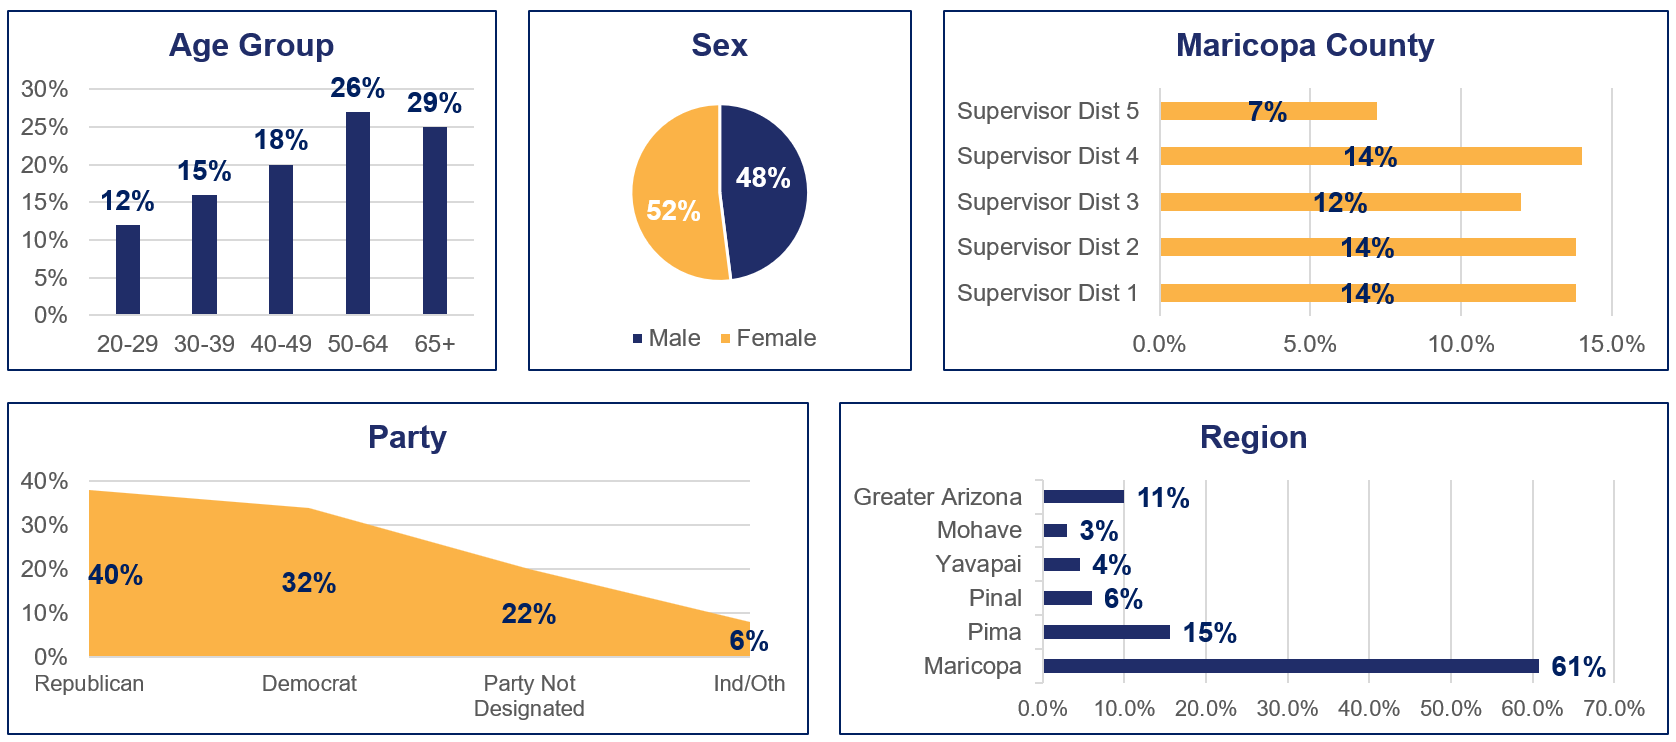
DEFINITIONS OF SUBGROUPS
All demographics are based on current voter registration files.
- Republican: those currently registered with the Republican party, based on the party registration currently in their voter file at the time of the survey.
- Democratic: those currently registered with the Democratic party, based on the party registration currently in their voter file at the time of the survey.
- Independent/unaffiliated: this group is made up of all other registered voters who are not registered as a Republican or Democrat. Currently, this group is made up of “Other” as defined by the Secretary of State (which includes those who wrote in “independent” or “no party” or “party not declared”) as well as the other recognized parties that represent less than 2% of registered voters in the state (Libertarian: 0.77%, No Labels: 0.68%, and Green 0.07%).
All age groups reflect the current age of voters at the time of the surveys.
- 20-29
- 30-39
- 40-49
- 50-64
- 65+
Survey Questions
There are two surveys conducted during each election cycle to inform the Arizona Voters’ Agenda.